Flow coefficient values dictate maximum fluid passing capabilities perfectly. You often struggle with incorrect flow calculations. Such errors cause massive pipe blowouts. One minor pressure drop ruins entire production quotas. A dependable butterfly valve cv chart solves this calculation nightmare instantly. Proper referencing prevents catastrophic system failures. We designed this guide for professionals seeking exact fluid metrics.
What defines a butterfly valve cv chart?
A butterfly valve cv chart defines exact fluid volume passing through per minute. It measures water flow accurately. You need this metric for proper sizing. Systems break when engineers ignore flow coefficients.
Designers rely heavily upon accurate capacity numbers constantly. Without proper data, pipelines face extreme pressure variations. We must calculate resistance carefully.
Core elements of flow data
Flow capacity involves multiple specific variables. Here’s the deal: pressure drop influences everything drastically. We calculate volume assuming constant temperature conditions.
Why does capacity matter?
Capacity dictates pipe survival or failure outright.
- Fluid velocity impacts material wear heavily.
- Improper sizing creates loud cavitation noises.
- Small valves restrict necessary flow rates.
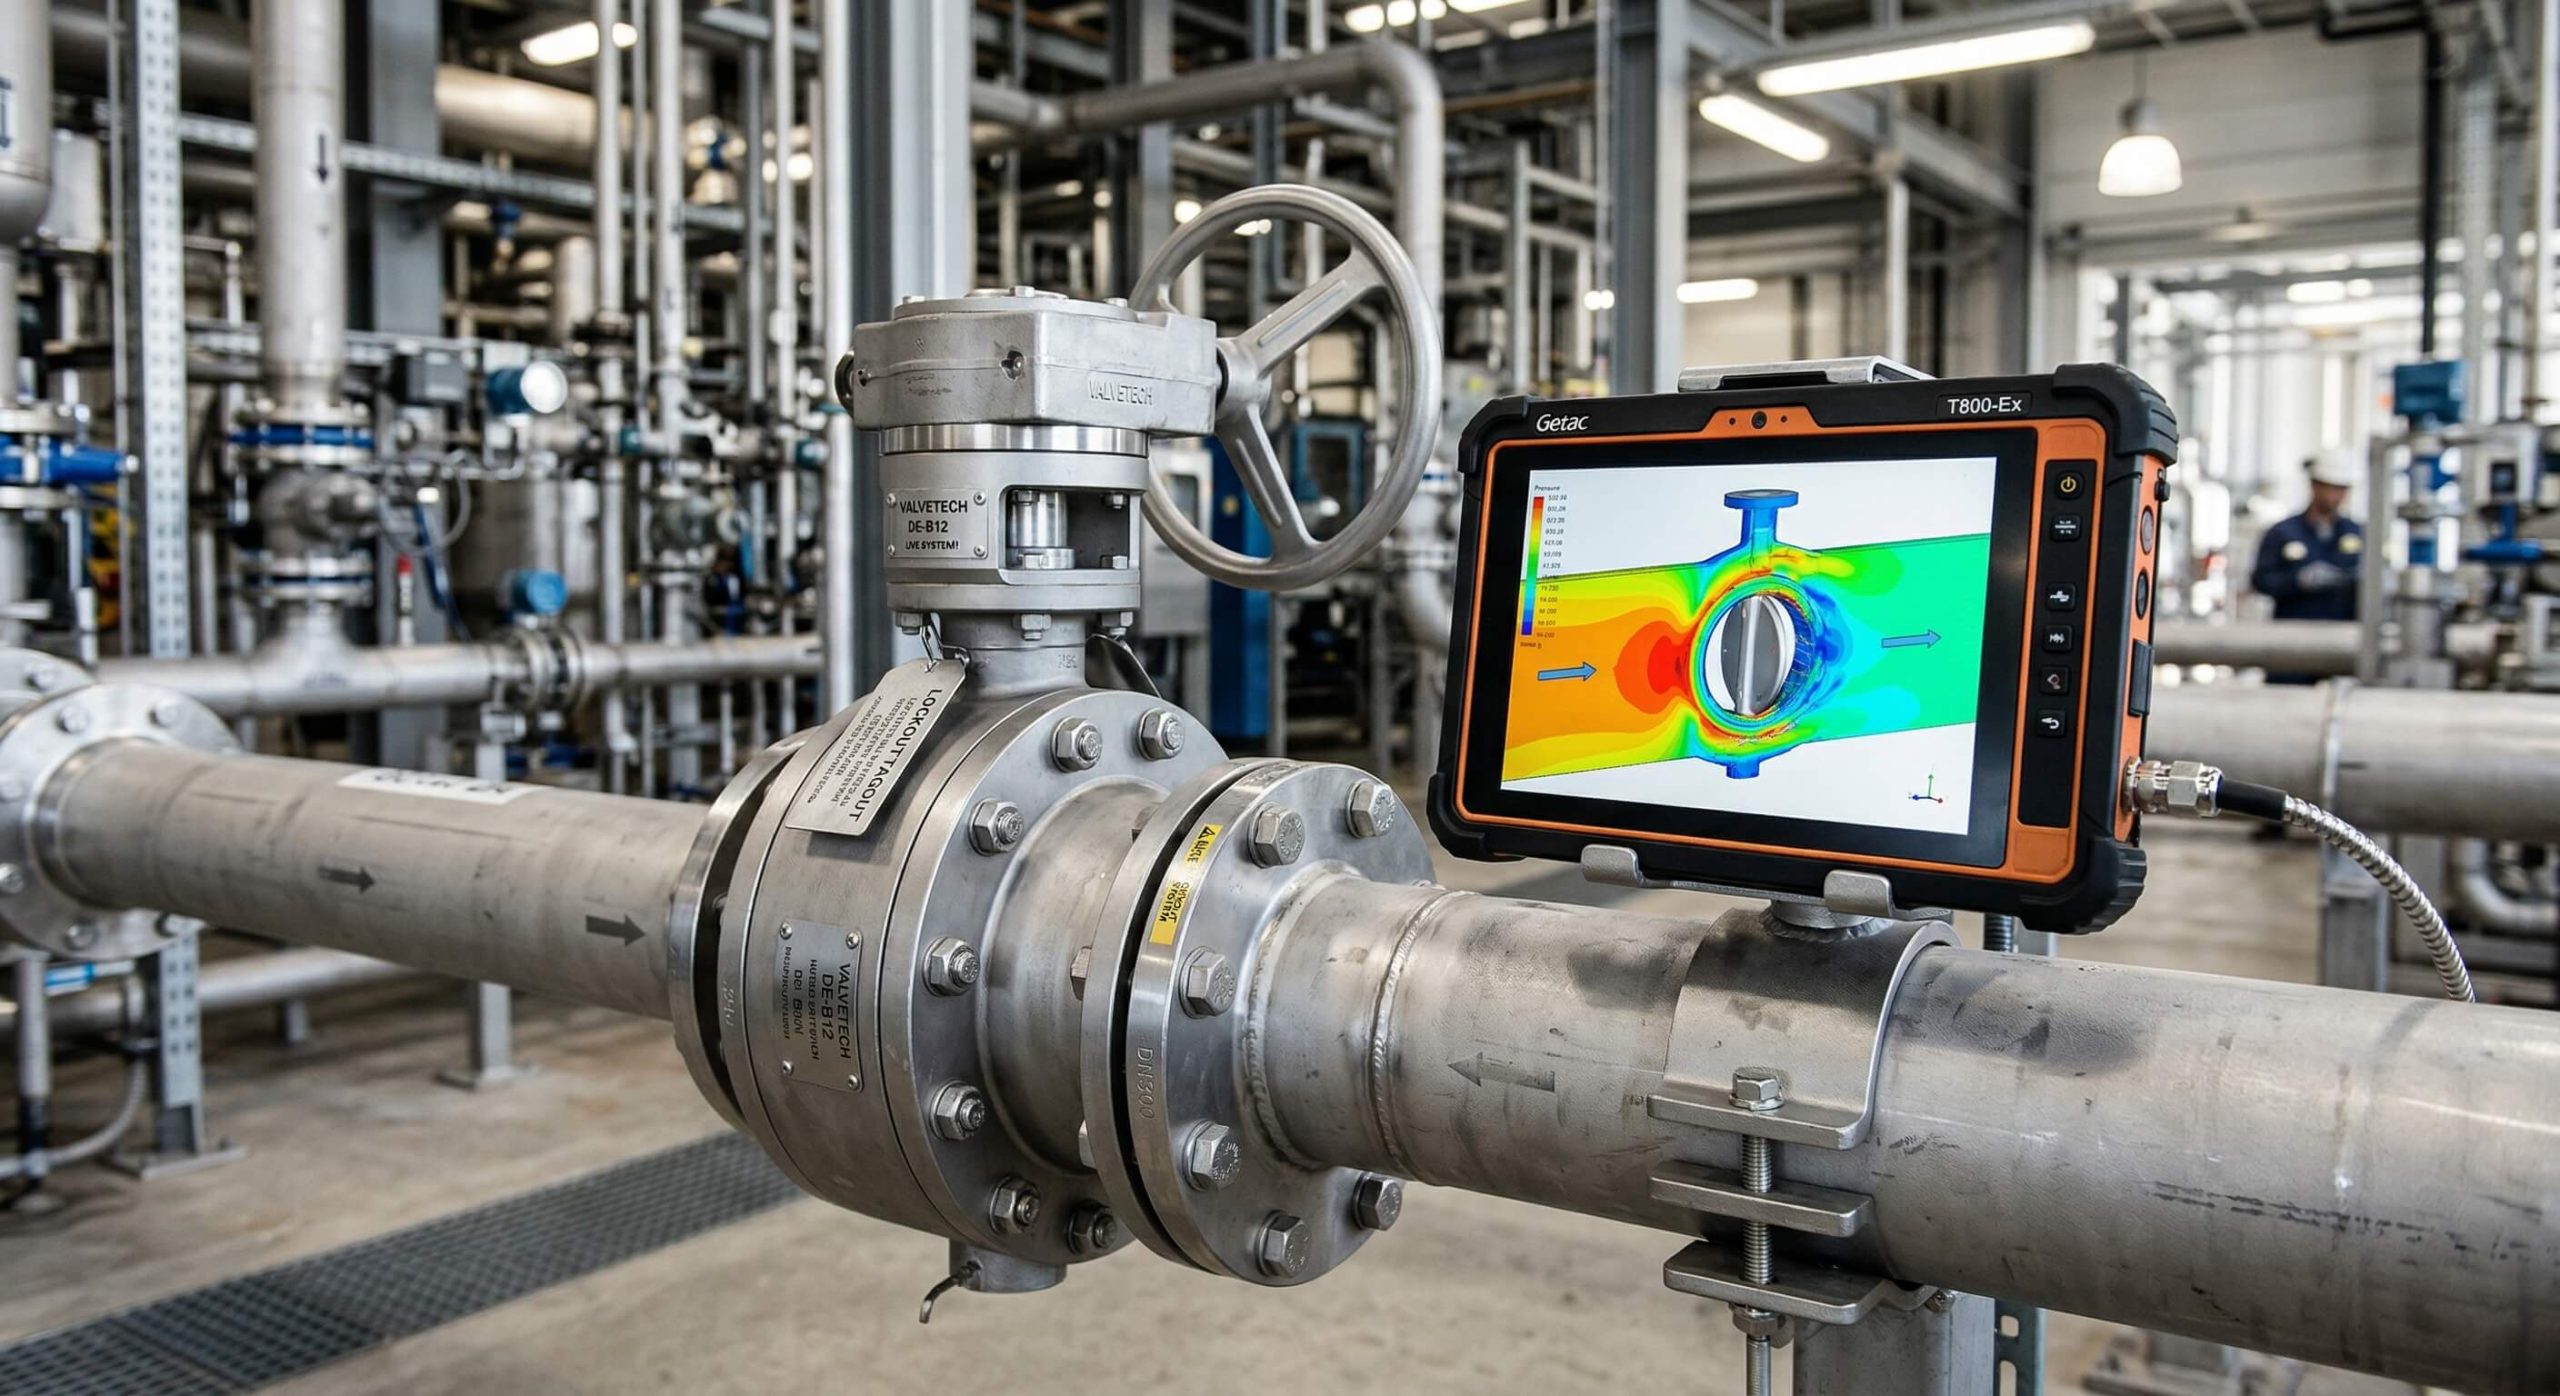
Reading standard diagrams
Diagrams provide visual data representation clearly. You must read horizontal axes carefully. Vertical lines show specific opening percentages.
| Valve Size | Opening 50% | Opening 100% |
|---|---|---|
| 2 inch | 45 | 115 |
| 4 inch | 180 | 450 |
| 6 inch | 420 | 1100 |
Larger sizes show exponential capacity growth at maximum openings.
Key Takeaway: Sizing your equipment accurately prevents costly pipeline breakdowns.
Why trust a butterfly valve cv chart?
You trust a butterfly valve cv chart because rigorous testing verifies every data point. Laboratory trials confirm flow rates repeatedly. Engineers test components under extreme conditions daily. Reliability remains unmatched across industrial applications.
Real-world results mirror laboratory findings consistently. Predicting fluid behavior becomes much easier. Professionals depend on verified empirical statistics.
Validating test methods
Manufacturers use standard water tests for validation. Think about that: precise calibration ensures absolute accuracy. Instruments record minor pressure fluctuations instantly.
How do engineers use data?
Professionals apply metrics for system design.
- They calculate pump requirements accurately.
- Designers predict energy consumption rates.
- Operators prevent unexpected surge events.
Ensuring reliable outputs
Quality control guarantees consistent product performance. Technicians monitor manufacturing processes closely. Every unit meets strict industry standards.
| Standard | Test Fluid | Accuracy Rate |
|---|---|---|
| ANSI | Water | 99% |
| ISO | Water | 98% |
| DIN | Water | 99% |
Global standards guarantee high precision across different testing environments.
Key Takeaway: Verified data allows engineers build safe piping networks confidently.
How can a butterfly valve cv chart help?
A butterfly valve cv chart helps by preventing catastrophic pressure failures entirely. You avoid purchasing oversized equipment unnecessarily. This saves substantial capital investment funds. Precise sizing optimizes overall fluid control.
Systems operate efficiently when components match perfectly. Energy waste drops significantly under ideal conditions. Pumps work less intensely during operation.
Cost reduction strategies
Proper sizing cuts energy bills drastically. You might be wondering: smaller components cost less upfront too. Maintenance expenses drop over time.
Improving system lifespan
Correct flow rates reduce physical component wear.
- Cavitation damage decreases notably.
- Vibration levels remain within safe limits.
- Seals last much longer.
Optimizing daily operations
Plant operators manage flows easily using accurate data. Adjustments happen smoothly without unexpected surges. Predictability improves overall plant safety.
| Component | Lifespan Before | Lifespan After |
|---|---|---|
| Seals | 1 Year | 3 Years |
| Discs | 2 Years | 5 Years |
| Pumps | 5 Years | 10 Years |
Optimized sizing drastically extends component longevity across industrial setups.
Key Takeaway: Accurate capacity calculations save money while improving mechanical reliability.
Where do you find a butterfly valve cv chart?
You find a butterfly valve cv chart inside manufacturer technical manuals usually. Digital catalogs feature comprehensive data tables online. Engineering handbooks contain standard reference diagrams too. Suppliers provide specific metrics upon request.
Quality vendors publish performance numbers publicly. Comparing different brands requires accessing these documents. Always verify information directly from manufacturers.
Official manufacturer websites
Direct sources offer highly reliable specifications. Let that sink in: outdated prints cause massive design errors. Digital platforms update numbers regularly.
Independent engineering forums
Communities share practical field experiences openly.
- Experts discuss real flow behaviors.
- Users verify published capacity numbers.
- Engineers recommend specific brand charts.
Technical specification sheets
Spec sheets detail exact performance limitations clearly. You must read fine print carefully. Operating conditions alter actual flow values.
| Source Type | Accuracy | Update Frequency |
|---|---|---|
| Manufacturer | High | Monthly |
| Forum | Medium | Variable |
| Handbook | High | Decade |
Direct manufacturer documentation provides most reliable update frequencies.
Key Takeaway: Always use recently updated vendor specifications for design calculations.
When should a butterfly valve cv chart apply?
A butterfly valve cv chart applies during initial pipeline design phases primarily. You must consult data before buying parts. Upgrading existing networks requires similar reference checks. Any flow alteration demands capacity recalculations.
Emergency repairs often need quick chart consultations. Replacing damaged components requires matching past specifications. Guessing sizes leads toward rapid system failure.
Initial design phases
Planning requires exact mathematical flow models. Here comes the truth: guessing dimensions creates disastrous operational bottlenecks. Engineers calculate requirements meticulously beforehand.
System expansion projects
Adding capacity changes pressure dynamics significantly.
- New branches alter main line flows.
- Pumps require readjustment completely.
- Upgraded valves handle increased volumes.
Routine maintenance checks
Audits verify ongoing system performance continuously. Technicians compare current flows against original diagrams. Discrepancies indicate possible internal component damage.
| Project Phase | Usage Frequency | Criticality |
|---|---|---|
| Design | Daily | High |
| Expansion | Weekly | High |
| Audit | Monthly | Medium |
Initial design stages demand constant metric consultation for safety.
Key Takeaway: Early data application prevents fundamental architectural errors during construction.
Can a butterfly valve cv chart fail you?
A butterfly valve cv chart fails you if fluid viscosity changes dramatically. Heavy syrups behave differently than pure water. Temperature spikes alter predicted flow volumes completely. Real conditions rarely match ideal lab setups perfectly.
Misinterpreting data causes significant operational issues quickly. Reading incorrect pressure drop columns leads astray. You must apply correction factors diligently.
Viscosity correction factors
Thick fluids require specific mathematical adjustments. Watch closely now: standard numbers only apply for water normally. Oil needs custom flow calculations always.
Temperature variance effects
Extreme heat expands internal metal components.
- Clearances shrink under high temperatures.
- Flow paths become slightly restricted.
- Capacity drops below published values.
Installation orientation problems
Mounting angles affect fluid turbulence patterns. Upright positions allow smooth liquid passage usually. Horizontal installations might create minor flow blockages.
| Fluid Type | Base CV | Adjusted CV |
|---|---|---|
| Water | 100 | 100 |
| Light Oil | 100 | 85 |
| Heavy Syrup | 100 | 60 |
Higher fluid viscosity demands severe capacity capability downgrades.
Key Takeaway: Always adjust standard numbers based on your specific fluid characteristics.
Who creates the butterfly valve cv chart?
Dedicated fluid dynamics engineers create the butterfly valve cv chart meticulously. Test facility technicians conduct hundreds of practical runs. Quality assurance teams verify every recorded number. Mathematicians model theoretical flows for comparison.
Collaboration ensures highly accurate published statistics ultimately. Independent laboratories audit manufacturer claims regularly. Certification bodies mandate strict testing procedures constantly.
Role of test engineers
These professionals run physical flow experiments. It gets better: automated sensors capture data flawlessly nowadays. Human error drops near zero entirely.
Quality control departments
Teams check numbers against theoretical models.
- They flag anomalous data points.
- They retest questionable flow results.
- They approve final document publications.
Third party certification
Outside agencies validate internal company findings. This builds immense trust among consumers. Independent stamps guarantee true product performance.
| Auditor | Verification Focus | Trust Level |
|---|---|---|
| Internal QA | Consistency | Good |
| Independent Lab | Accuracy | Excellent |
| Govt Agency | Safety | Maximum |
Third party verification provides maximum confidence regarding published flow metrics.
Key Takeaway: Multi-level testing protocols ensure standard diagrams remain absolutely reliable.
Does a butterfly valve cv chart vary often?
A butterfly valve cv chart varies often between different manufacturer brands. Unique internal disc designs alter fluid paths. Different seating materials change overall internal clearances. You cannot swap brand charts blindly.
Even similar sizes behave differently across product lines. A high-performance model outpaces standard versions easily. Always check specific series documentation carefully.
Brand design differences
Patented shapes improve aerodynamic fluid flow. You read that correctly: a slight curve increases capacity dramatically. Every millimeter matters during fluid transit.
Material impact on capacity
Internal linings change available passage areas.
- Thick rubber reduces open space.
- Thin metal maximizes flow volumes.
- Teflon coatings smooth fluid travel.
High performance variants
Double offset designs handle massive pressures. Their unique geometry alters standard flow calculations. Standard diagrams do not apply here.
| Valve Style | 4 Inch CV | 6 Inch CV |
|---|---|---|
| Concentric | 450 | 1100 |
| Double Offset | 380 | 950 |
| Triple Offset | 320 | 800 |
Complex offset designs naturally restrict flow compared with concentric models.
Key Takeaway: Never assume universal capacity numbers across varying mechanical designs.
Are butterfly valve cv chart metrics rigid?
Butterfly valve cv chart metrics are not perfectly rigid universally. Wear alters internal dimensions over time slowly. Corrosion creates rough surfaces that hinder flow. You must expect minor capacity degradation eventually.
Age transforms theoretical perfection into practical reality. An older system loses maximum flow potential. Engineers calculate safety margins anticipating this wear.
Impact of internal corrosion
Rust builds up along metal surfaces. Consider this fact: rough walls create massive fluid turbulence. Smooth laminar flow becomes highly chaotic.
Seat degradation over time
Rubber components swell or shrink unpredictably.
- Chemical exposure alters seal shapes.
- Heat hardens flexible seating materials.
- Physical tearing causes internal leaks.
Applying safety margins
Smart designers oversize components slightly always. This compensates for future capacity losses perfectly. Systems run smoothly despite minor wear.
| Age | Surface Condition | CV Retention |
|---|---|---|
| New | Smooth | 100% |
| 5 Years | Minor Pitting | 95% |
| 10 Years | Heavy Rust | 80% |
Prolonged service life significantly reduces theoretical fluid capacity capabilities.
Key Takeaway: Incorporating conservative safety margins protects systems from gradual performance degradation.
How to interpret a butterfly valve cv chart?
You interpret a butterfly valve cv chart by matching size with angle. Find your required flow rate first. Then scan downward toward appropriate opening percentages. This reveals proper nominal pipe sizes quickly.
Interpolation helps estimate numbers between listed values. Sometimes exact requirements fall between standard sizes. You must round up for safety normally.
Finding maximum capacity
The hundred percent column shows peak limits. Wait, there’s more: operating at maximum opens invites cavitation. Experts recommend running at mid-range capacities.
Understanding control ranges
Throttling happens best between specific angles.
- Avoid operating below twenty degrees.
- Control diminishes past seventy degrees.
- Sweet spots lie right midway.
Practical sizing examples
Let us select a part for water. We need five hundred gallons per minute. We choose a six inch model.
| Target Flow | Recommended Size | Ideal Angle |
|---|---|---|
| 100 GPM | 3 Inch | 60 Degrees |
| 500 GPM | 6 Inch | 50 Degrees |
| 1000 GPM | 8 Inch | 55 Degrees |
Keeping operations near fifty degrees ensures optimal fluid control stability.
Key Takeaway: Correct interpretation guarantees smooth mechanical throttling without causing damaging vibrations.
FAQ
Q1: Can I use one chart for all brands?
You cannot use universal charts safely. Different manufacturers utilize unique internal geometries altering capacity values significantly.
Q2: What’s the best operating angle for throttling?
Fifty degrees provides ideal throttling stability. This position offers stable control while avoiding damaging cavitation effects.
Q3: How do I know if my chart remains updated?
You know older charts lack relevance when manufacturers release newer product lines. Always verify document dates against vendor websites directly.
Q4: Can I apply water metrics against heavy oil?
You must not apply water data directly. Oil possesses higher viscosity requiring specific mathematical correction factors for accuracy.
Q5: What’s the best way toward handling capacity degradation?
Adding a ten percent safety margin works best. This proactive step compensates for future internal wear completely.
Conclusion
Our comprehensive guide resolves your complex flow calculation dilemmas completely. We deliver precision instruments handling extreme industrial demands flawlessly. Selecting proper equipment ensures long-term operational success for everyone involved. We build reliable solutions conquering your toughest fluid control challenges today. Please contact us for specialized engineering assistance immediately.