Flow coefficient (Cv) represents water volume flowing through partially open valves with one psi pressure drops. You are finalizing a massive pipeline project smoothly. Suddenly, incorrect valve sizing causes severe pump cavitation. This threatens equipment ruin and delayed operations. Selecting proper components using a butterfly valve pressure drop chart guarantees systems run flawlessly from day one.
What Is A Butterfly Valve Pressure Drop Chart?
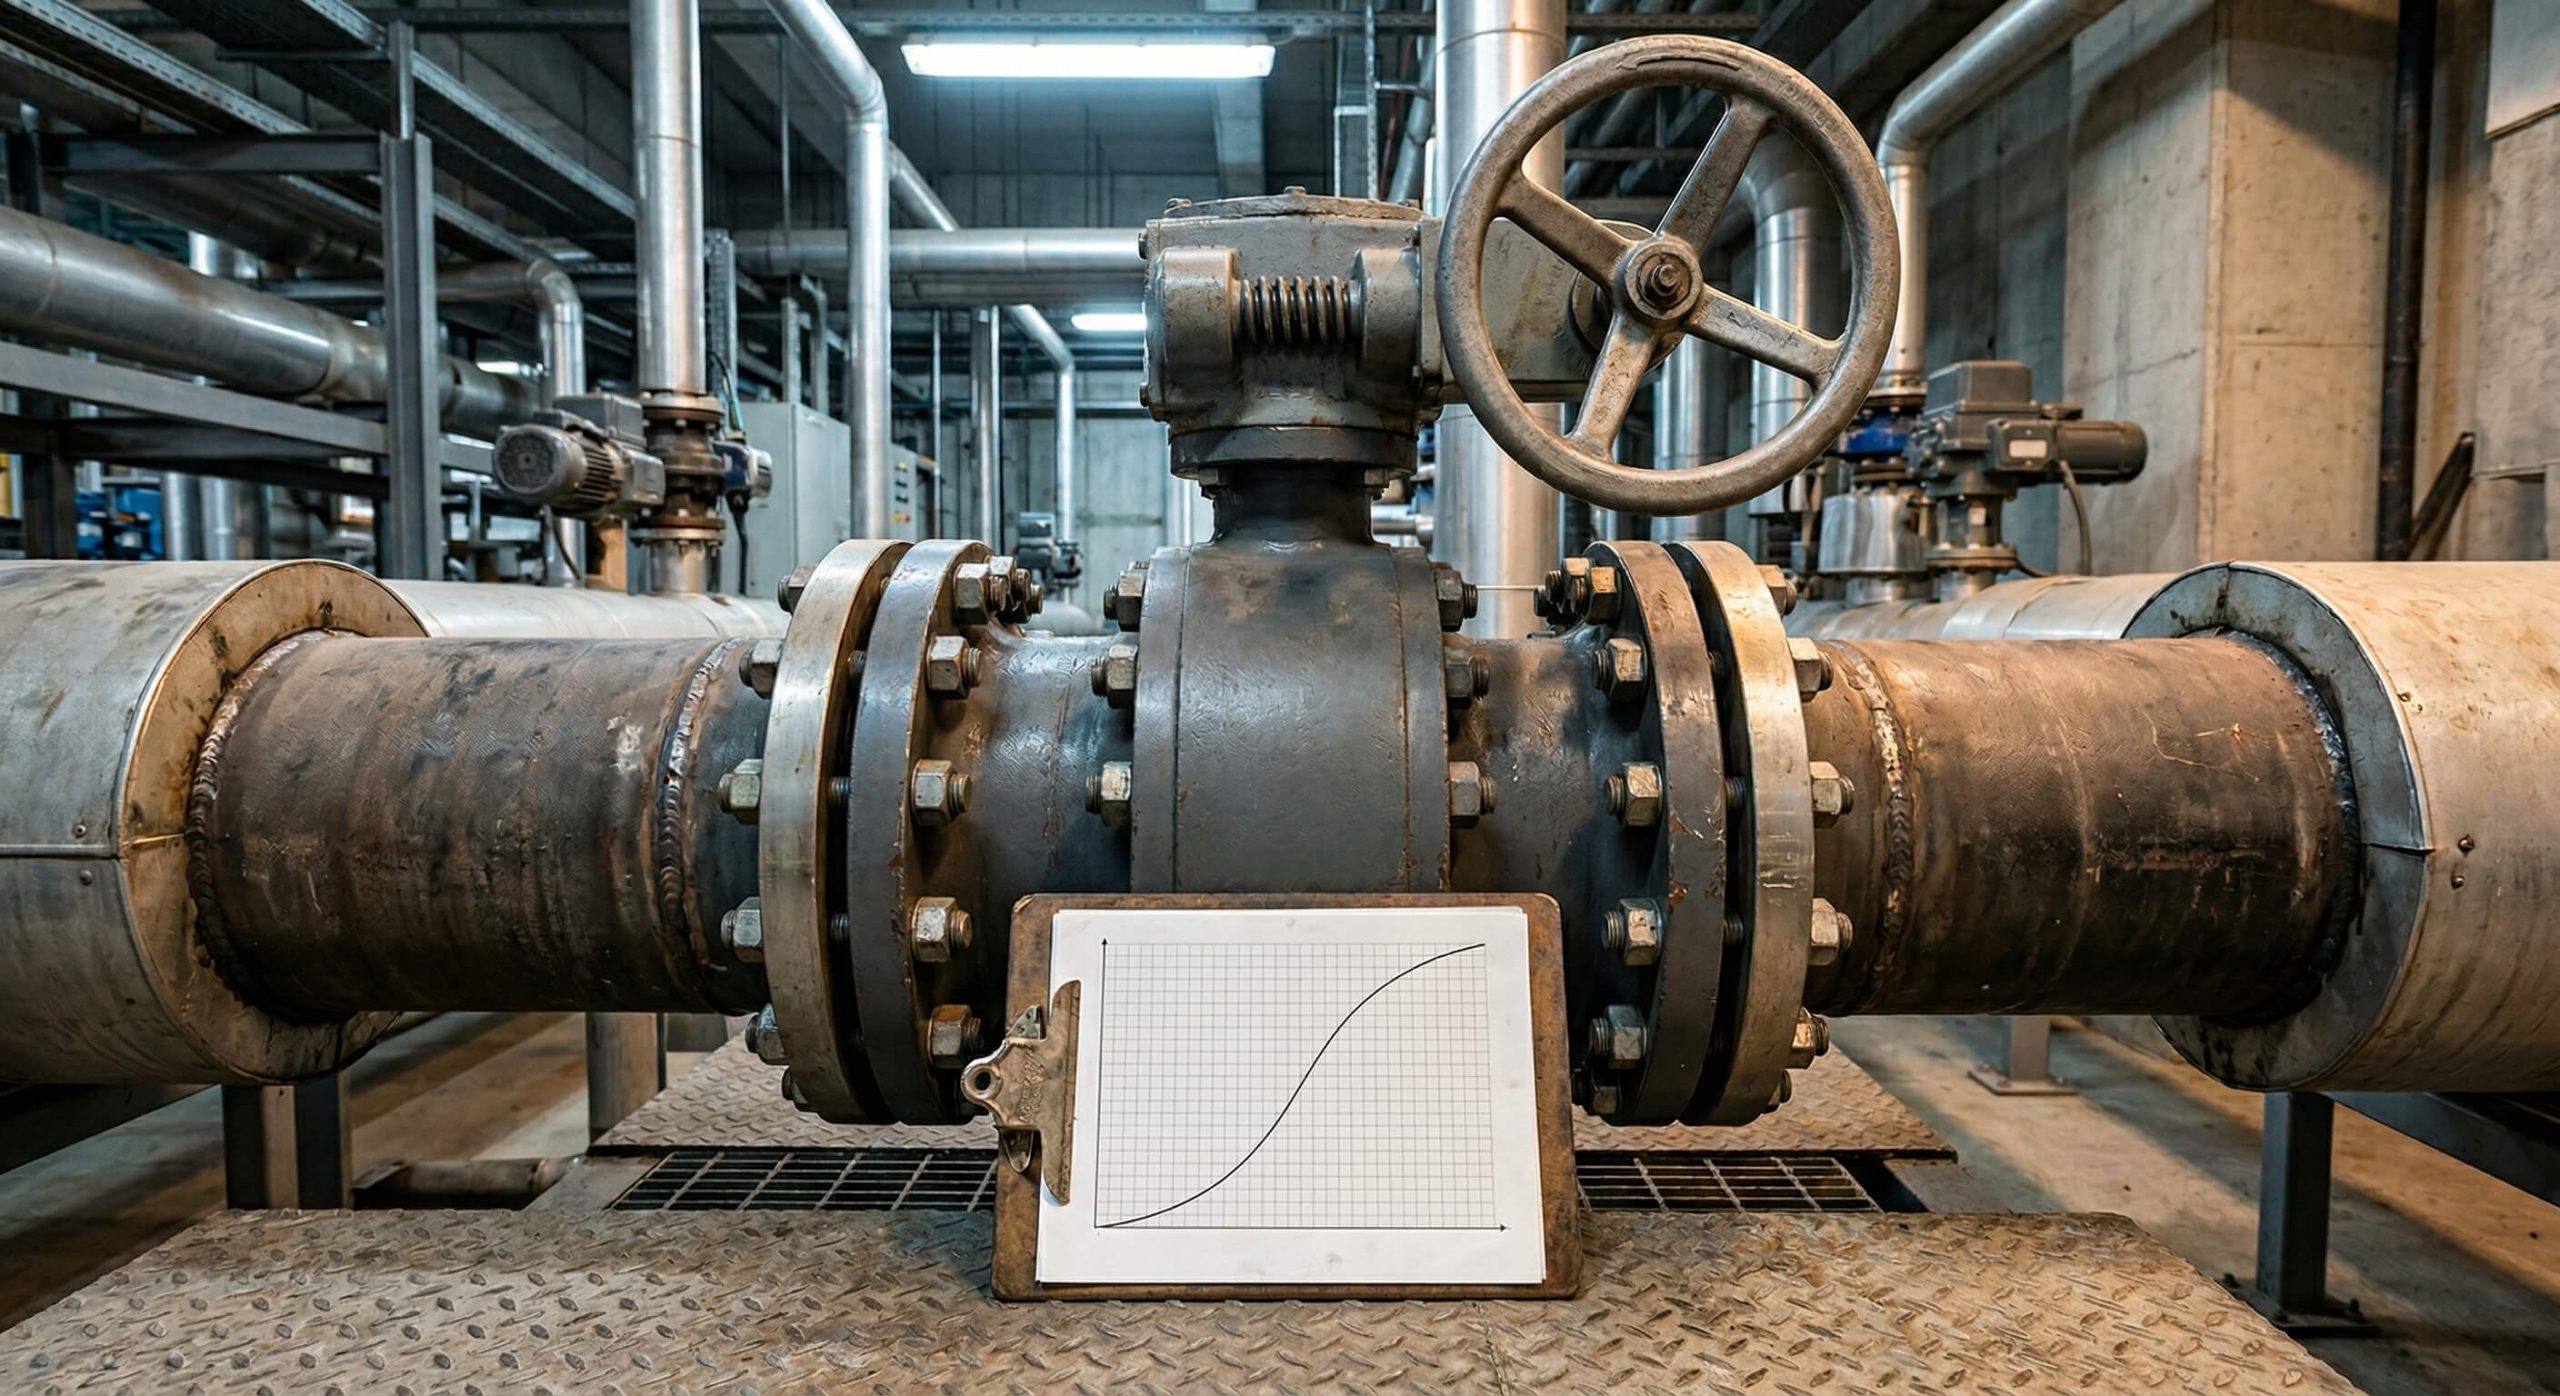
A butterfly valve pressure drop chart works as a graphical tool determining pressure loss. It plots Cv against disc position. Engineers use it for understanding resistance. Using this metric secures ideal system design while preventing energy waste.
Basics Of Flow Coefficient
Here’s the deal: grasping flow metrics remains critical for any fluid system. Cv values denote water volume flowing through valves having one psi loss.
- It indicates overall valve capacity.
- Metrics help compare different sizes.
- Data determines overall pipeline efficiency. Without this metric, selecting correct equipment becomes a guessing game.
Defining Pressure Loss In Valves
You might be wondering: why does pressure decrease occur? Friction within valve bodies causes kinetic energy conversion into heat.
- Disc thickness creates physical resistance.
- Pipe friction adds extra drops.
- Fluid viscosity impacts flow rates. Evaluating these metrics helps you minimize unnecessary energy consumption.
Key Takeaway: Grasping these charts allows you to select exact valves needed. You maintain desired flow rates without overworking pumps.
| Metric | Description | Impact Level |
|---|---|---|
| Cv Value | Flow capacity indicator | High |
| Valve Angle | Disc opening position | High |
| Fluid Density | Mass per unit volume | Medium |
This table displays how different metrics critically influence pipeline efficiency.
How Does A Butterfly Valve Pressure Drop Chart Work?
A butterfly valve pressure drop chart operates by mapping fluid behaviors. It correlates disc angles against expected resistance levels. Professionals rely on these visualizations for accurate predictions. This prevents unexpected operational failures.
Understanding Flow Dynamics
What’s the real story? Fluids behave differently when encountering obstacles. Changing disc angles alter available flow areas significantly.
- Fully open valves minimize resistance.
- Partially closed discs create turbulence.
- Velocity changes cause dynamic shifts. Engineers calculate these variations accurately using graphical representations.
Are Cv Values Constant?
But here’s the kicker… flow coefficients fluctuate based on disc positioning. A fully open component offers maximum flow capacity.
- Angles below thirty degrees restrict flow.
- Mid-range positions provide linear control.
- Maximum angles yield peak volumes. Recognizing these fluctuations keeps your system balanced.
Key Takeaway: Mastering dynamic flow behaviors empowers you for better system regulation. You avoid costly maintenance issues caused by uneven pressures.
| Disc Angle | Flow Behavior | Resistance Level |
|---|---|---|
| 10 Degrees | Highly restricted | Maximum |
| 45 Degrees | Linear control | Moderate |
| 90 Degrees | Full capacity | Minimum |
Chart data highlights how opening angles directly control internal resistance levels.
Why Use A Butterfly Valve Pressure Drop Chart?
Using a butterfly valve pressure drop chart prevents catastrophic system failures. It guides engineers toward making informed component selections. Accurate sizing reduces long-term operational costs. Precision remains non-negotiable for industrial applications.
Optimizing Pipeline Efficiency
Ready for the good part? Proper sizing maximizes your operational efficiency. Pumping fluids through undersized lines wastes massive electricity amounts.
- Accurate sizing reduces energy bills.
- Correct components extend pump lifespans.
- Optimized flows prevent material degradation. Matching components correctly saves thousands in annual operational budgets.
Preventing Pump Cavitation
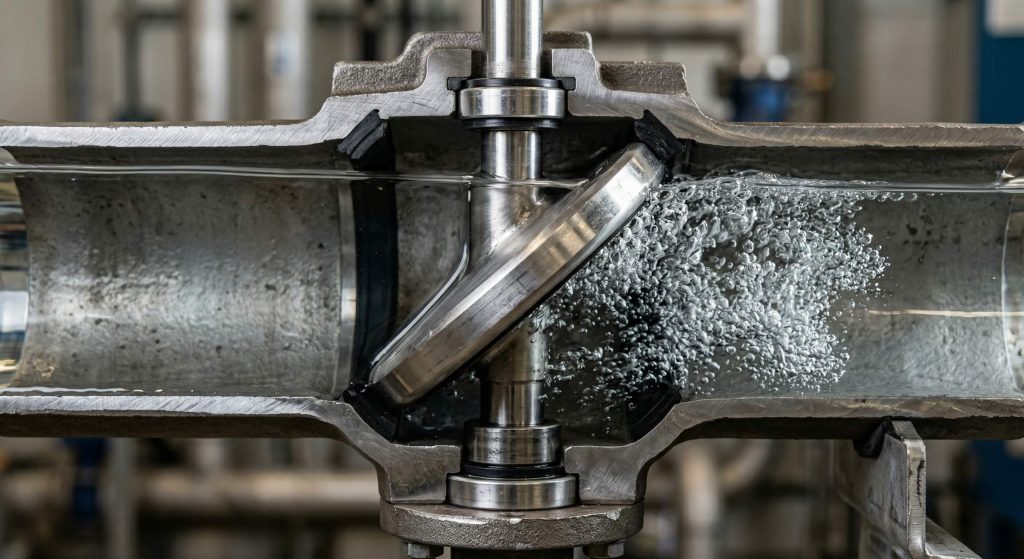
This is where it gets interesting… severe pressure drops trigger cavitation. Vapor bubbles form and collapse violently within fluids.
- Cavitation destroys internal metal surfaces.
- Vibrations loosen critical pipe joints.
- Noise levels indicate severe damage. Consulting reference charts helps you avoid these destructive phenomena entirely.
Key Takeaway: Prioritizing accurate reference data protects your expensive pumping equipment. You secure reliable operations across all industrial processes.
| Issue | Root Cause | Preventive Action |
|---|---|---|
| Cavitation | Excessive pressure drop | Accurate sizing |
| Energy Loss | Undersized components | Chart consultation |
| Vibration | Turbulent flow patterns | Velocity control |
Identifying root causes enables proactive maintenance strategies for fluid networks.
Who Needs A Butterfly Valve Pressure Drop Chart?
A butterfly valve pressure drop chart benefits numerous industrial professionals. Anyone handling fluid control systems relies on this data. It provides a common technical language across departments. Teams collaborate effectively using standardized metrics.
Engineers And System Designers
Think about it: designers build foundations for entire industrial facilities. They require precise metrics for specifying correct parts.
- Designers calculate entire network requirements.
- Engineers verify safety margin tolerances.
- Consultants approve final project blueprints. Reliable data forms the backbone of safe engineering practices.
Maintenance And Operations
Let me explain: daily operators need tools for troubleshooting issues. Unexplained pressure losses often indicate failing internal components.
- Technicians diagnose specific blockage locations.
- Operators adjust flow rates safely.
- Maintenance teams plan replacement schedules. Accessing graphical references empowers teams during emergency repair situations.
Key Takeaway: Equipping your staff with proper reference materials boosts productivity. Teams resolve mechanical issues faster using standardized documentation.
| User Role | Primary Application | Benefit |
|---|---|---|
| Engineer | System design | Precise sizing |
| Operator | Daily monitoring | Issue detection |
| Technician | Troubleshooting | Faster repairs |
Empowering diverse teams with technical data improves overall operational harmony.
Can A Butterfly Valve Pressure Drop Chart Help Sizing?
A butterfly valve pressure drop chart provides exact sizing parameters. Guessing component dimensions leads toward inevitable mechanical failures. Proper diagrams eliminate uncertainty during procurement phases. You buy exactly what your system demands.
Matching Valves With Pipe Sizes
Want to know a secret? Line sizes rarely dictate actual valve requirements. Fluids moving rapidly might require smaller control components.
- Smaller components offer better control.
- Matching pipes precisely causes inefficiencies.
- Velocity dictates actual dimension needs. Reviewing technical graphs reveals true dimension requirements accurately.
Avoiding Oversized Components
It gets better: oversized parts perform poorly regarding flow regulation. Discs operating near closed positions suffer rapid wear.
- Small openings cause severe wire-drawing.
- Oversized units lack precision control.
- Excessive weight strains pipe supports. Sizing correctly keeps operations smooth while preventing premature mechanical wear.
Key Takeaway: Right-sizing equipment guarantees fine-tuned control over your fluid networks. You avoid unnecessary structural stress on pipe connections.
| Dimension Strategy | Outcome | Risk Level |
|---|---|---|
| Line Size Match | Poor control | High |
| Chart Based | Precise regulation | Low |
| Oversized | Rapid wear | Very High |
Selecting dimension strategies based on data minimizes structural risk factors.
How Do You Read A Butterfly Valve Pressure Drop Chart?
Reading a butterfly valve pressure drop chart requires basic technical literacy. You locate your desired flow rate on one axis. Then you intersect it with specific opening angles. This reveals expected Cv values instantly.
Identifying Disc Opening Angles
Why does this matter? Charts display multiple curves representing different positions. Each curve illustrates specific behavioral patterns under load.
- Ten degrees shows minimal flow.
- Forty-five degrees indicates moderate volumes.
- Ninety degrees means maximum capacity. Selecting appropriate curves ensures accurate mathematical projections for pipelines.
Correlating Flow And Pressure
Look at it this way: intersecting lines reveal hidden system dynamics. You pinpoint exact resistance levels at specific volumes.
- Vertical axes usually represent Cv.
- Horizontal axes show opening angles.
- Curved lines map physical performance. Tracing these visual intersections yields precise numerical values for engineers.
Key Takeaway: Interpreting visual data correctly prevents catastrophic calculation errors. You confidently predict fluid behavior under varying operational loads.
| Chart Element | Represents | Application |
|---|---|---|
| Vertical Axis | Flow coefficient | Capacity check |
| Horizontal Axis | Opening angle | Position setting |
| Plotted Curves | Performance limits | System design |
Understanding graphical elements unlocks deeper insights into mechanical performance capabilities.
When Should You Check A Butterfly Valve Pressure Drop Chart?
Consulting a butterfly valve pressure drop chart remains necessary during multiple phases. Initial design stages rely heavily on these metrics. Troubleshooting also requires referencing original baseline numbers. Continuous monitoring prevents sudden catastrophic failures.
During Initial System Design
Here is the truth: fixing mistakes post-installation costs a fortune. Designers must verify capacities before pouring concrete foundations.
- Drafting requires accurate component specifications.
- Procurement needs exact technical details.
- Safety standards demand verified calculations. Doing math early prevents expensive modifications later during construction.
Upgrading Existing Pipelines
Consider this: adding new capacity strains older fluid networks. Retrofitting demands careful analysis of existing pressure capabilities.
- New pumps increase system velocities.
- Older valves might choke flows.
- Upgrades alter entire dynamic profiles. Checking reference materials guarantees safe integration of modern pumping equipment.
Key Takeaway: Timing your technical reviews correctly saves massive capital expenditures. You integrate new parts without compromising existing infrastructure integrity.
| Project Phase | Primary Goal | Action |
|---|---|---|
| Design | Specify components | Review curves |
| Upgrade | Verify capacity | Recalculate Cv |
| Maintenance | Troubleshoot issues | Compare baselines |
Strategic technical reviews during specific project phases mitigate financial risks.
Where Do You Find A Butterfly Valve Pressure Drop Chart?
Locating a butterfly valve pressure drop chart involves checking reliable sources. Manufacturers publish specific data for their proprietary designs. Generic engineering handbooks provide broad theoretical estimates. Always prefer exact manufacturer documentation for accuracy.
Manufacturer Specifications
Now, pay attention: proprietary designs feature unique internal geometries. Generic data cannot account for specific disc shapes.
- Catalogs contain exact testing data.
- Websites offer downloadable PDF sheets.
- Support teams provide customized charts. Using exact manufacturer metrics prevents dangerous miscalculations in critical applications.
Engineering Data Handbooks
What does this mean for you? Handbooks serve as excellent starting points. They help designers estimate preliminary network requirements quickly.
- Textbooks explain underlying mathematical principles.
- Industry standards provide baseline safety margins.
- Reference guides offer quick approximations. While useful, always verify preliminary estimates against final vendor specifications.
Key Takeaway: Sourcing accurate technical documents guarantees safety compliance for industrial builds. You protect your investments by avoiding generalized theoretical assumptions.
| Data Source | Accuracy Level | Best Use |
|---|---|---|
| Manufacturer | Very High | Final design |
| Handbook | Moderate | Preliminary estimates |
| Software | High | Dynamic modeling |
Selecting appropriate data sources impacts overall safety for structural designs.
What Affects A Butterfly Valve Pressure Drop Chart?
Several factors alter a butterfly valve pressure drop chart output. Fluid properties change how resistance builds internally. Physical component designs also dictate dynamic flow behaviors. Recognizing these variables ensures accurate real-world performance.
Fluid Density And Viscosity
Let’s break it down: thicker fluids require more energy for movement. Heavy oils behave differently than pure drinking water.
- High viscosity increases internal friction.
- Dense fluids require higher pressures.
- Temperature changes alter viscosity ratings. Adjusting standard calculations for specific fluids prevents severe operational bottlenecks.
Valve Body And Disc Design
The best part? Modern engineering minimizes internal physical obstructions. Aerodynamic discs slice through fluids with minimal drag.
- Concentric designs offer standard resistance.
- Eccentric discs reduce friction significantly.
- Seat materials impact flow slightly. Selecting advanced aerodynamic components boosts your overall system efficiency margins.
Key Takeaway: Accounting for physical variables elevates your engineering precision significantly. You adapt generic data into highly accurate real-world operational models.
| Variable | Influence Area | Effect |
|---|---|---|
| Viscosity | Internal friction | Increases resistance |
| Disc Shape | Fluid turbulence | Alters flow path |
| Temperature | Fluid density | Changes Cv |
Monitoring environmental variables provides context for expected mechanical performance deviations.
How Precise Is A Butterfly Valve Pressure Drop Chart?
A butterfly valve pressure drop chart provides highly accurate baseline metrics. However, real-world conditions introduce minor unpredictable variables constantly. Engineers apply safety margins for absorbing these operational fluctuations. True precision requires blending data with practical experience.
Lab Testing Versus Field Data
But wait, there is more: laboratories control environmental variables perfectly. Real pipelines experience turbulent flows from nearby elbows.
- Labs use ideal straight pipes.
- Field setups feature complex geometries.
- Real fluids contain microscopic debris. Understanding these discrepancies helps professionals interpret published metrics more realistically.
Accounting For Safety Margins
Here is the bottom line: operating at absolute maximum limits invites disaster. Smart designers incorporate buffers into their mathematical models.
- Adding twenty percent capacity helps.
- Buffers absorb unexpected pressure surges.
- Margins compensate for pipe scaling. Building conservative systems guarantees longevity across decades of continuous service.
Key Takeaway: Applying intelligent safety margins transforms theoretical numbers into robust realities. You build resilient systems capable of handling unexpected operational stresses.
| Condition | Environment | Reliability |
|---|---|---|
| Lab Test | Controlled | Absolute |
| Field Op | Variable | High (with margins) |
| Surge Event | Unpredictable | Requires buffer |
Evaluating operational environments contextualizes published technical data for better decision-making.
Conclusion
Here are our final thoughts on this topic. Flow coefficient metrics guide professionals toward safe industrial designs. Reviewing reference charts prevents destructive cavitation while optimizing energy consumption. Sizing components correctly requires diligence. We help teams achieve flawless fluid control systems through precision engineering. Contact us today for reliable solutions. Quality performance defines our industry vision.
FAQ
Q1: Can I calculate Cv without a chart?
Yes, you can calculate it mathematically. You use complex formulas involving flow rates and specific gravity. However, charts provide instant visual verification.
Q2: What’s the best way of measuring pressure drops?
You should use differential pressure gauges. Install them upstream and downstream across your pipeline. This provides accurate real-time operational data.
Q3: How do I know if my valve is undersized?
Listen for unusually loud noises. Severe vibration indicates highly restrictive flows. Excessive energy bills also point toward severe sizing issues.
Q4: Does fluid temperature affect flow coefficients?
Yes, temperature affects it absolutely. Temperature alters fluid viscosity significantly. You must adjust standard calculations for extreme thermal conditions.
Q5: Are chart values applicable for all fluids?
No, they are not directly applicable. Standard charts use pure water baselines. You must calculate specific gravity correction factors for other liquids.