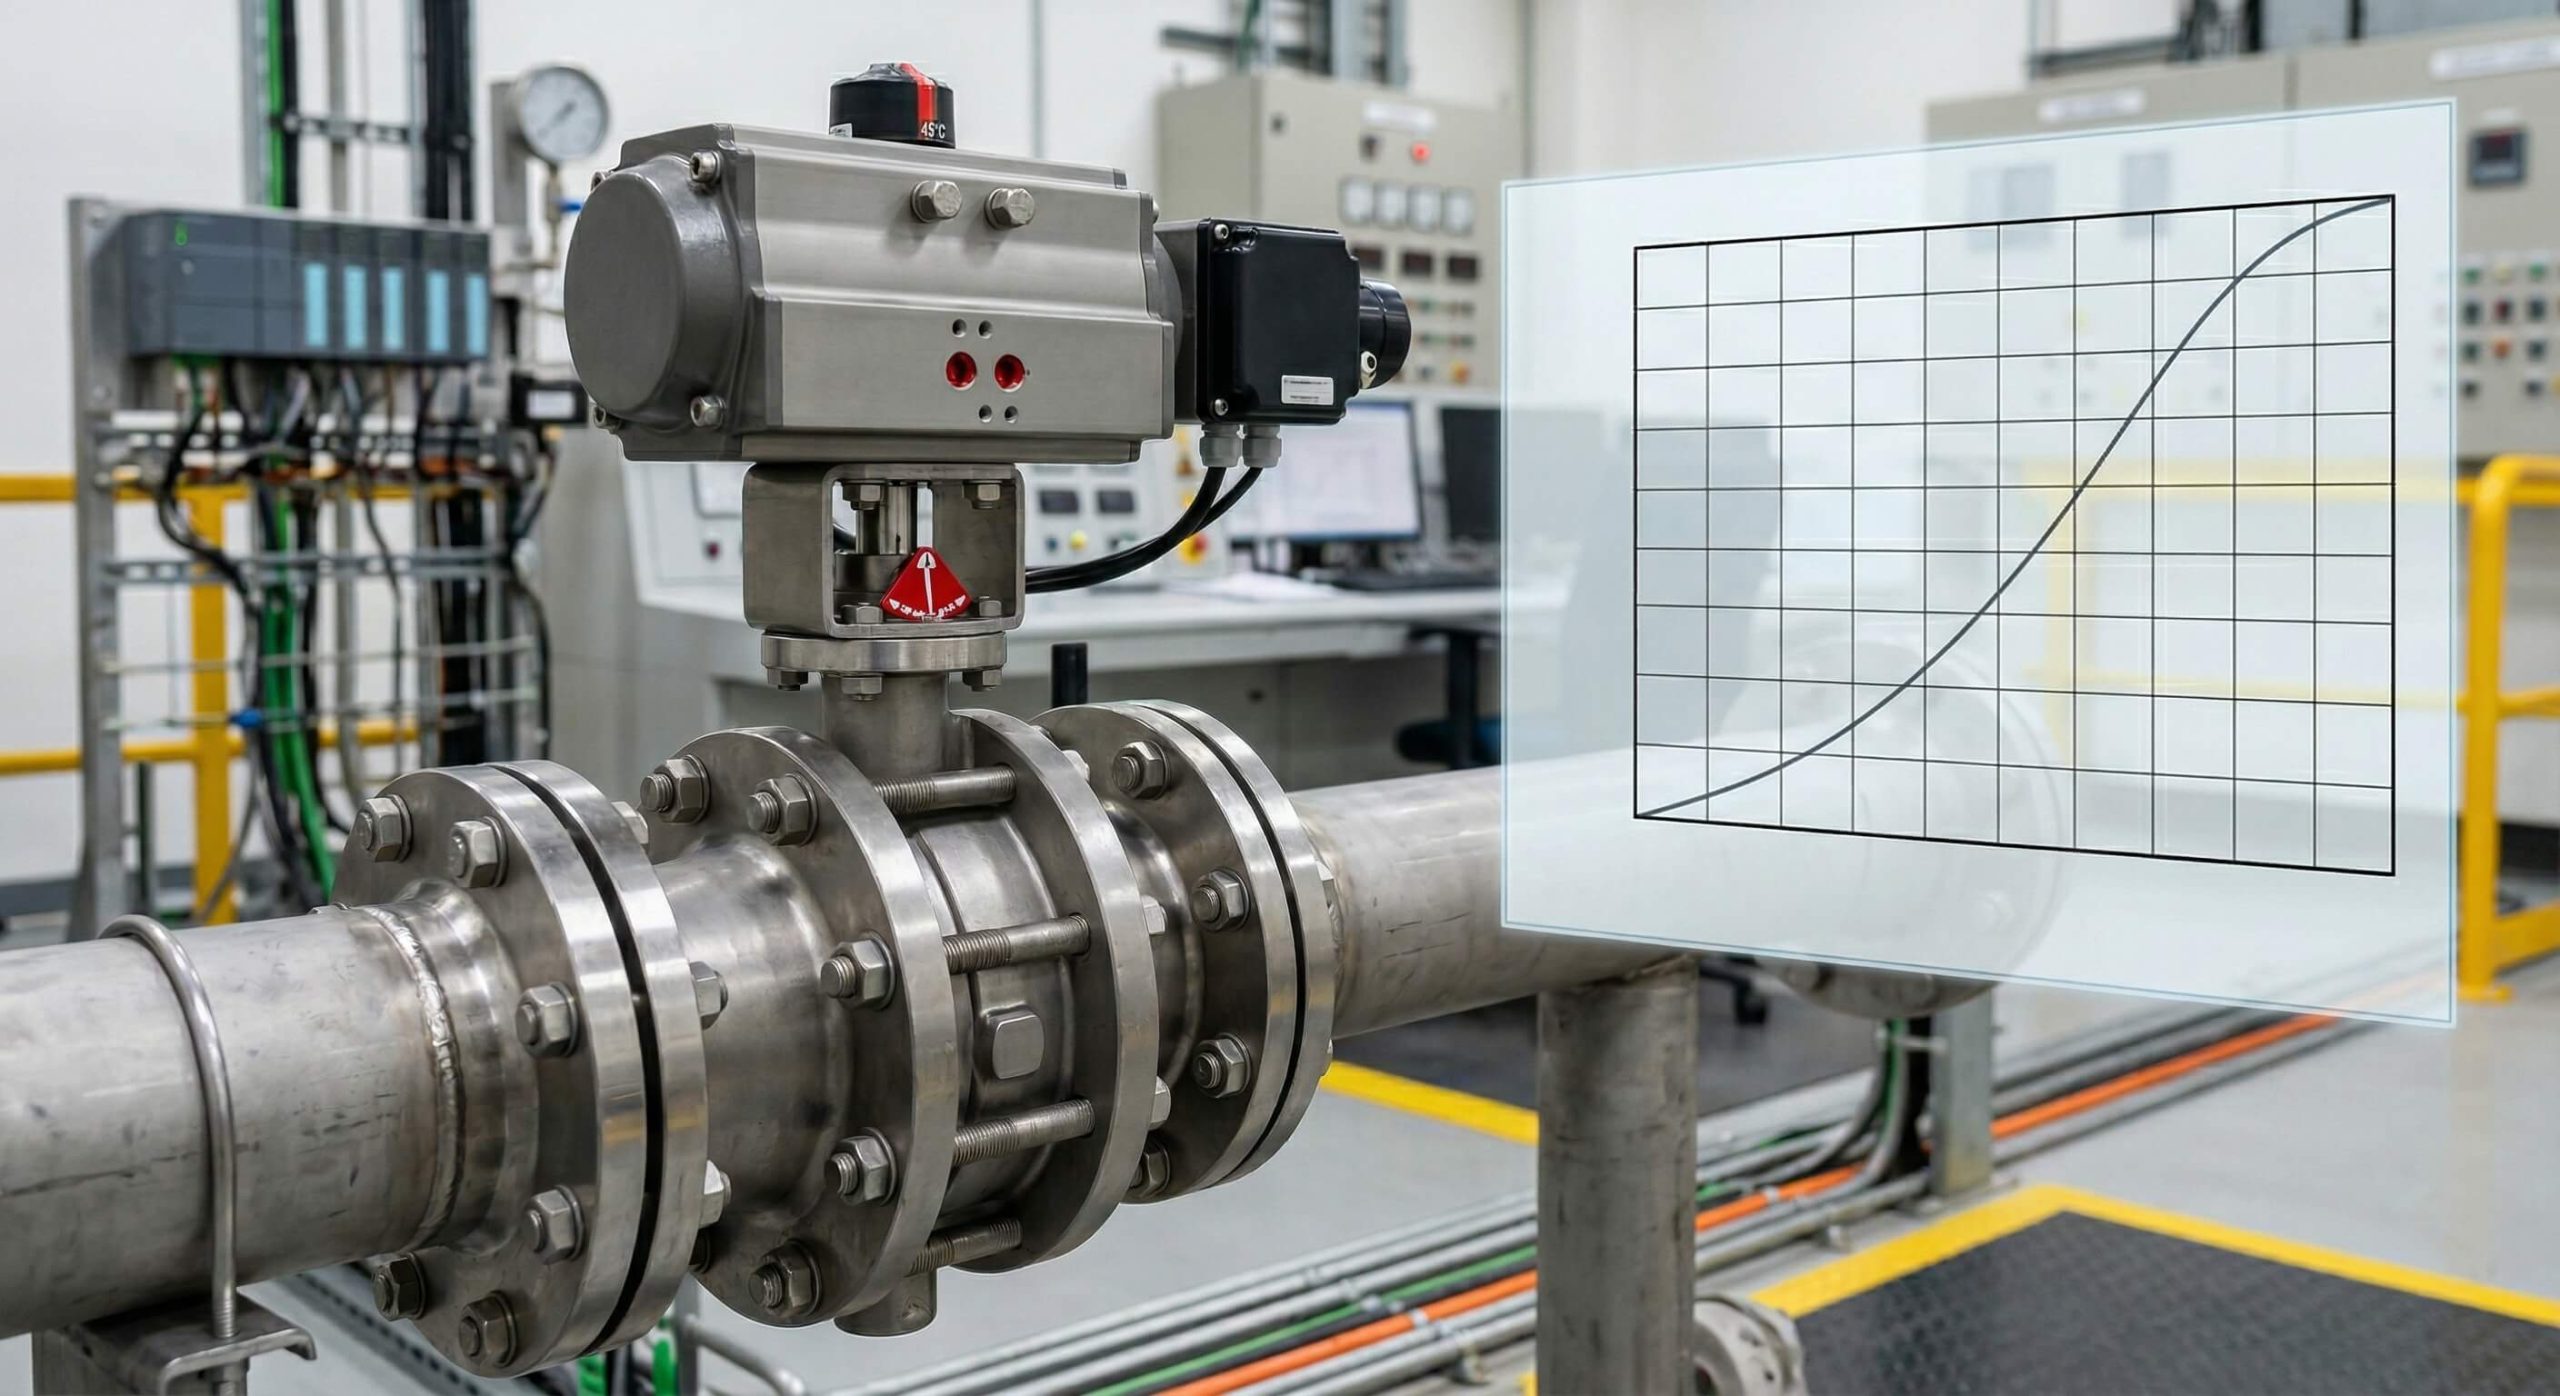
A butterfly valve characteristic curve is a graphical plot showing how the flow rate (Cv or Kv) changes in direct proportion to the valve’s opening angle. Industrial systems often suffer from “hunting” control loops and excessive energy loss due to unpredictable flow regulation. If you ignore how a valve reacts to small movements, you risk high-pressure surges and premature equipment failure. By utilizing a precise butterfly valve characteristic curve, you can align your mechanical hardware with process demands to ensure long-term stability.
What is a butterfly valve characteristic curve?
This curve is the “fingerprint” of the valve, representing the relationship between the percentage of valve travel and the resulting flow capacity under constant pressure. It serves as a vital tool for engineers to visualize how the device will perform once installed in a live piping network.
Defining Flow Rate and Valve Travel
Here is the bottom line. You need to understand that this curve essentially maps out the efficiency of the disc at various angles from 0 to 90 degrees. It allows for the prediction of hydraulic behavior before the system is even commissioned.
- X-Axis: Represents the relative opening or travel percentage.
- Y-Axis: Represents the relative flow coefficient or flow rate.
- Profile: Dictates the sensitivity of the valve during adjustment.
Key Takeaway: The characteristic curve is the essential bridge between mechanical valve design and predictable hydraulic performance in your facility.
Summary Table: Basics of Characteristic Curves
Use this guide to identify the core components of any standard performance graph.
| Parameter | Description | Metric |
|---|---|---|
| Opening Degree | The physical angle of the disc | 0° to 90° |
| Flow Capacity | The volume of fluid passing through | Cv or Kv |
| Inherent Data | Lab-tested performance values | Percentage (%) |
Why use an equal percentage butterfly valve characteristic curve?
Most industrial butterfly valves utilize this profile because it provides consistent sensitivity across a wider range of flow conditions. This butterfly valve characteristic curve ensures that equal increments of valve travel produce an equal percentage change in the existing flow rate.
Understanding Logarithmic Response
You might be wondering. Why is this specific shape preferred over a simple linear line? An equal percentage response allows for very fine adjustments at low flow rates while providing high capacity at the fully open position.
- Low Flow Precision: Small disc movements result in tiny flow changes.
- High Flow Power: Large opening angles allow for massive volume increases.
- System Stability: Prevents sudden pressure spikes during the opening sequence.
Key Takeaway: Choosing an equal percentage curve helps you maintain stable control loops even when system pressures fluctuate significantly.
Summary Table: Profile Advantages
This table highlights why the equal percentage model dominates the industrial market.
| Feature | Equal Percentage | Benefit to You |
|---|---|---|
| Sensitivity | Logarithmic | High control at low flow |
| Rangeability | Wide | Handles varying loads |
| Versatility | Excellent | Suitable for most fluids |
Does the butterfly valve characteristic curve impact throttling?
Yes, the curve dictates where the valve performs best, typically within the 30° to 70° range where regulation is most predictable. When you operate outside of this specific “Goldilocks Zone,” the valve often loses its sensitivity and its ability to regulate flow with precision.
Finding the Goldilocks Zone
Think about it. If you try to throttle a valve at 5% open, you risk high-velocity erosion and cavitation. However, between 30 and 70 degrees, the disc provides a stable environment for fluid modulation.
- Avoid 0-15%: Excessive wear and poor control sensitivity.
- Target 30-70%: Optimal range for active process regulation.
- Limit 80-90%: Diminishing returns in flow increase relative to movement.
Key Takeaway: Effective throttling requires you to size the valve so the normal operating point sits squarely in the middle of the characteristic curve.
Summary Table: Throttling Ranges
Consult this guide to ensure your valve is operating in the most efficient zone.
| Range | Behavior | Recommended Use |
|---|---|---|
| 0° – 30° | High Resistance | Initial opening only |
| 30° – 70° | Linear Sensitivity | Throttling and Control |
| 70° – 90° | Plateauing Flow | Maximum volume discharge |
What are the stages of a butterfly valve characteristic curve?
A standard curve consists of an initial slow-rise stage, a steep intermediate control stage, and a final plateauing stage near full open. This butterfly valve characteristic curve follows a “slow-fast-slow” progression that is unique to the geometry of the rotating disc.
Analyzing the Slow-Fast-Slow Profile
Here’s the deal. Because the disc must clear the seat and then rotate into the stream, the flow area does not increase at a uniform rate. You must account for these mechanical stages when programming your automated actuators.
- Stage 1: The disc breaks the seal, causing a minimal flow increase.
- Stage 2: The disc angle opens the throat rapidly, resulting in exponential flow.
- Stage 3: The disc aligns with the pipe, and flow reaches its maximum limit.
Key Takeaway: Recognizing these three distinct stages allows you to tune your control systems for smoother transitions and less mechanical stress.
Summary Table: Curve Stages
This guide breaks down the performance changes you will see across the travel range.
| Stage | Opening % | Hydraulic Effect |
|---|---|---|
| Initial | 0 – 25% | High resistance, low volume |
| Modulating | 25 – 75% | Predictable, rapid growth |
| Terminal | 75 – 100% | Near-constant maximum flow |
How do you calculate Cv from a butterfly valve characteristic curve?
You calculate the Flow Coefficient (Cv) by mapping specific opening percentages against known flow data provided in the manufacturer’s technical datasheet. This calculation allows you to determine exactly how many gallons of water per minute will pass through the valve at a 1 PSI pressure drop.
Mathematical Cv Determination
It gets better. You don’t have to guess your flow rates when you have access to a verified performance curve. By combining the curve data with your system’s specific gravity and pressure drop, you get an exact performance metric.
- Pressure Drop (ΔP): The difference between upstream and downstream pressure.
- Specific Gravity (G): The density of the fluid relative to water.
- Flow Rate (Q): The resulting volume output calculated on the Y-axis.
Key Takeaway: Calculating Cv using the curve ensures you select a valve that provides the necessary capacity without sacrificing control precision.
Summary Table: Cv Calculation Factors
Use these variables to solve for the specific performance needs of your project.
| Variable | Symbol | Purpose |
|---|---|---|
| Flow Coefficient | Cv | Measures flow capacity |
| Opening Angle | θ | Determines the current Cv |
| Differential P | ΔP | Drives the fluid through the valve |
Is the butterfly valve characteristic curve used for sizing?
Engineering teams rely on these curves to prevent oversizing, ensuring the valve doesn’t operate in the unstable range near the seat. A properly applied butterfly valve characteristic curve ensures your normal flow occurs when the valve is about 60% open.
Avoiding the Pitfalls of Oversizing
The secret is this. If you choose a valve that is too large, you will be forced to operate at very low angles where the curve is most unpredictable. This leads to “hunting,” where the actuator constantly adjusts back and forth without finding stability.
- Proper Fit: Normal flow should sit between 50% and 70% open.
- Safety Margin: Maximum flow should not exceed 85% of total capacity.
- Minimum Flow: Should remain above the 15% mark to avoid vibration.
Key Takeaway: Correct sizing based on the characteristic curve extends the life of your valve and improves the accuracy of your process.
Summary Table: Sizing Recommendations
Follow these benchmarks to ensure your valve is perfectly matched to your piping system.
| Flow Condition | Target Opening | Rationale |
|---|---|---|
| Normal | 50% – 60% | Highest control sensitivity |
| Maximum | 75% – 85% | Allows for surge headroom |
| Minimum | > 20% | Prevents seat erosion |
Can a butterfly valve characteristic curve help troubleshooting?
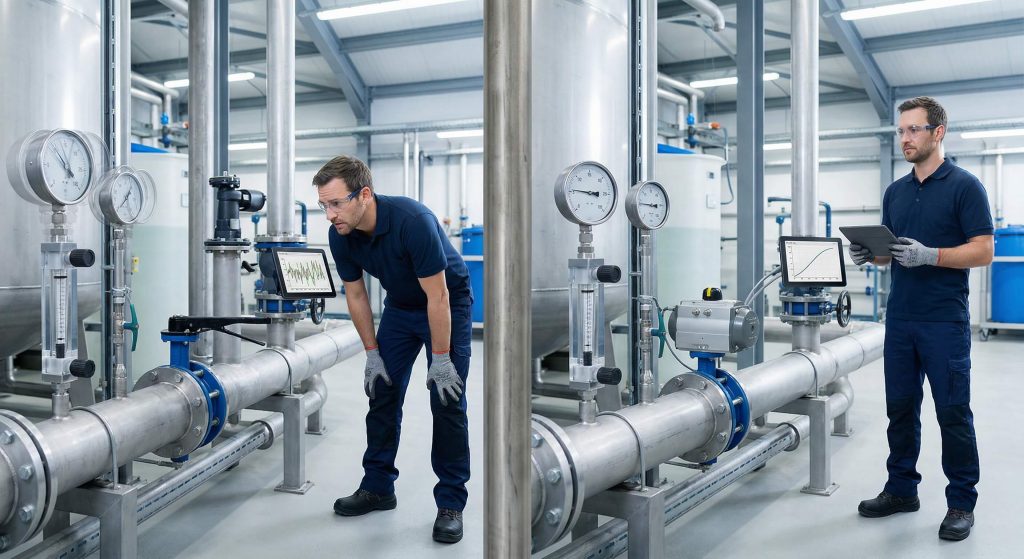
It serves as a diagnostic tool, where deviations between actual flow and the theoretical curve point to mechanical wear or debris. You can compare real-time sensor data against the manufacturer’s curve to identify if your valve is losing its sealing or regulating integrity.
Identifying System Deviations
You might not realize it. When your flow doesn’t match the expected curve position, it is often the first sign of an internal obstruction or a bent valve stem. Regular monitoring against the curve baseline can prevent unplanned shutdowns.
- Curve Shift: Indicates mechanical wear or seat displacement.
- Flow Drop: Suggests a partial blockage within the valve throat.
- Inconsistency: Points to actuator lag or loose mechanical linkages.
Key Takeaway: Using the characteristic curve as a diagnostic baseline allows you to move from reactive repairs to a proactive maintenance strategy.
Summary Table: Troubleshooting Signs
Match these physical symptoms to curve data to find the root cause of your issues.
| Symptom | Deviation | Potential Cause |
|---|---|---|
| Vibration | Low-angle operation | Cavitation or flashing |
| Low Flow | Actual Cv < Curve Cv | Scale buildup or debris |
| Hunting | Oscillating position | Oversized valve or lag |
How does design change the butterfly valve characteristic curve?
The physical architecture—whether it is a concentric, double-offset, or triple-offset design—directly modifies the slope and linearity of the curve. This butterfly valve characteristic curve becomes more refined and closer to a “true” equal percentage in high-performance offset models.
Mechanical Offset Impact
Let’s look closer. A concentric valve has a simpler curve that is best suited for low-pressure water, whereas a triple-offset valve provides a precise profile for critical steam and chemical service.
- Concentric: Standard curve, prone to seat friction at low angles.
- Double Offset: Improved curve with reduced seat contact during travel.
- Triple Offset: Geometry designed for zero-leakage and high-precision control.
Key Takeaway: Selecting the right mechanical design ensures that the valve’s physical movement translates into the exact flow curve your process requires.
Summary Table: Design vs. Curve Type
Consider how the physical build of the valve impacts your regulation capabilities.
| Design Type | Curve Profile | Best Application |
|---|---|---|
| Concentric | Near-Equal % | General utilities/Water |
| Double Offset | Enhanced Equal % | Chemicals and steam |
| Triple Offset | Precision Equal % | High pressure/Critical |
Does the butterfly valve characteristic curve improve efficiency?
By matching the valve’s performance profile to system requirements, you minimize pressure drops and reduce the energy consumed by pumps. You can operate your system with a higher turndown ratio, meaning one valve can handle a wider range of flows without losing accuracy.
Optimizing System Turndown
The bottom line is. A reliable curve allows you to run your system at the lowest possible pressure drop while still maintaining control. This directly translates to lower utility bills and less wear and tear on your pumping infrastructure.
- Lower ΔP: Reduces the energy required to force fluid through the valve.
- Steady Flow: Minimizes the turbulence that causes pipe vibration.
- Longer Life: Prevents the damage caused by operating in high-wear zones.
Key Takeaway: Aligning your operations with the most efficient part of the characteristic curve is a simple way to boost your plant’s bottom line.
Summary Table: Efficiency Gains
See how a well-matched curve contributes to a more sustainable operation.
| Factor | Benefit | Result |
|---|---|---|
| Precision | Less overshoot | Material cost savings |
| Stability | Less vibration | Maintenance cost savings |
| Energy | Optimized ΔP | Electricity cost savings |
Where applies the butterfly valve characteristic curve in industry?
These curves are applied globally in HVAC, chemical processing, and water treatment to ensure precise temperature and pressure regulation. This butterfly valve characteristic curve is the industry standard for managing large volumes of fluid in a compact, cost-effective manner.
Real-World Process Implementation
In the real world. You will find these curves used to calibrate automated systems in power plants, where cooling water must be perfectly balanced to maintain condenser vacuum. Without this data, these critical systems would be impossible to automate.
- HVAC Systems: Controlling chilled water to match thermal loads.
- Water Treatment: Regulating chemical dosing and effluent flow.
- Power Plants: Managing high-volume cooling and steam bypass.
Key Takeaway: Regardless of your specific niche, the characteristic curve is the primary tool used to ensure your valve performs as intended in a live environment.
Summary Table: Industrial Application Matrix
Identify where your specific industry relies on these performance curves.
| Industry | Typical Fluid | Primary Goal |
|---|---|---|
| HVAC | Chilled Water | Temperature stability |
| Chemical | Corrosive Media | Precise flow dosing |
| Water | Raw/Potable Water | Pressure management |
Conclusion
Understanding the butterfly valve characteristic curve is the first step toward achieving a truly optimized industrial system. By aligning your hardware selection with these technical performance benchmarks, you eliminate the guesswork that leads to energy waste and mechanical failure. Our goal is to provide the engineering clarity you need to build more resilient, efficient, and profitable operations. If you require expert guidance or a custom performance analysis for your next project, contact us today to speak with a specialist.
Frequently Asked Questions
- Can I use a butterfly valve for high-precision linear control?
No, because butterfly valves naturally exhibit an equal percentage or fast-opening characteristic rather than a linear one. While you can use a characterized positioner to “linearize” the response, the mechanical geometry remains non-linear. - What’s the best range to operate a butterfly valve?
The 30° to 70° range is optimal for regulation. Below 30°, the valve is too sensitive and prone to wear, while above 70°, the flow rate begins to plateau, offering less control for every degree of movement. - Can I change the characteristic curve after installation?
No, the inherent curve is fixed by the physical shape of the disc and body. However, you can modify the “installed characteristic” by using a digital actuator with a custom mapping profile to simulate a different response. - What’s the best way to verify a valve’s Cv?
You should always consult the manufacturer’s official flow characteristic curve and technical datasheet. These values are determined through rigorous laboratory testing and provide the most accurate baseline for your calculations. - Can I use a concentric valve for steam throttling?
No, this is generally not recommended because the high temperatures and pressures of steam can quickly damage the soft seats of a concentric valve. For steam throttling, a high-performance double or triple-offset valve with a hard-faced seat is required.