
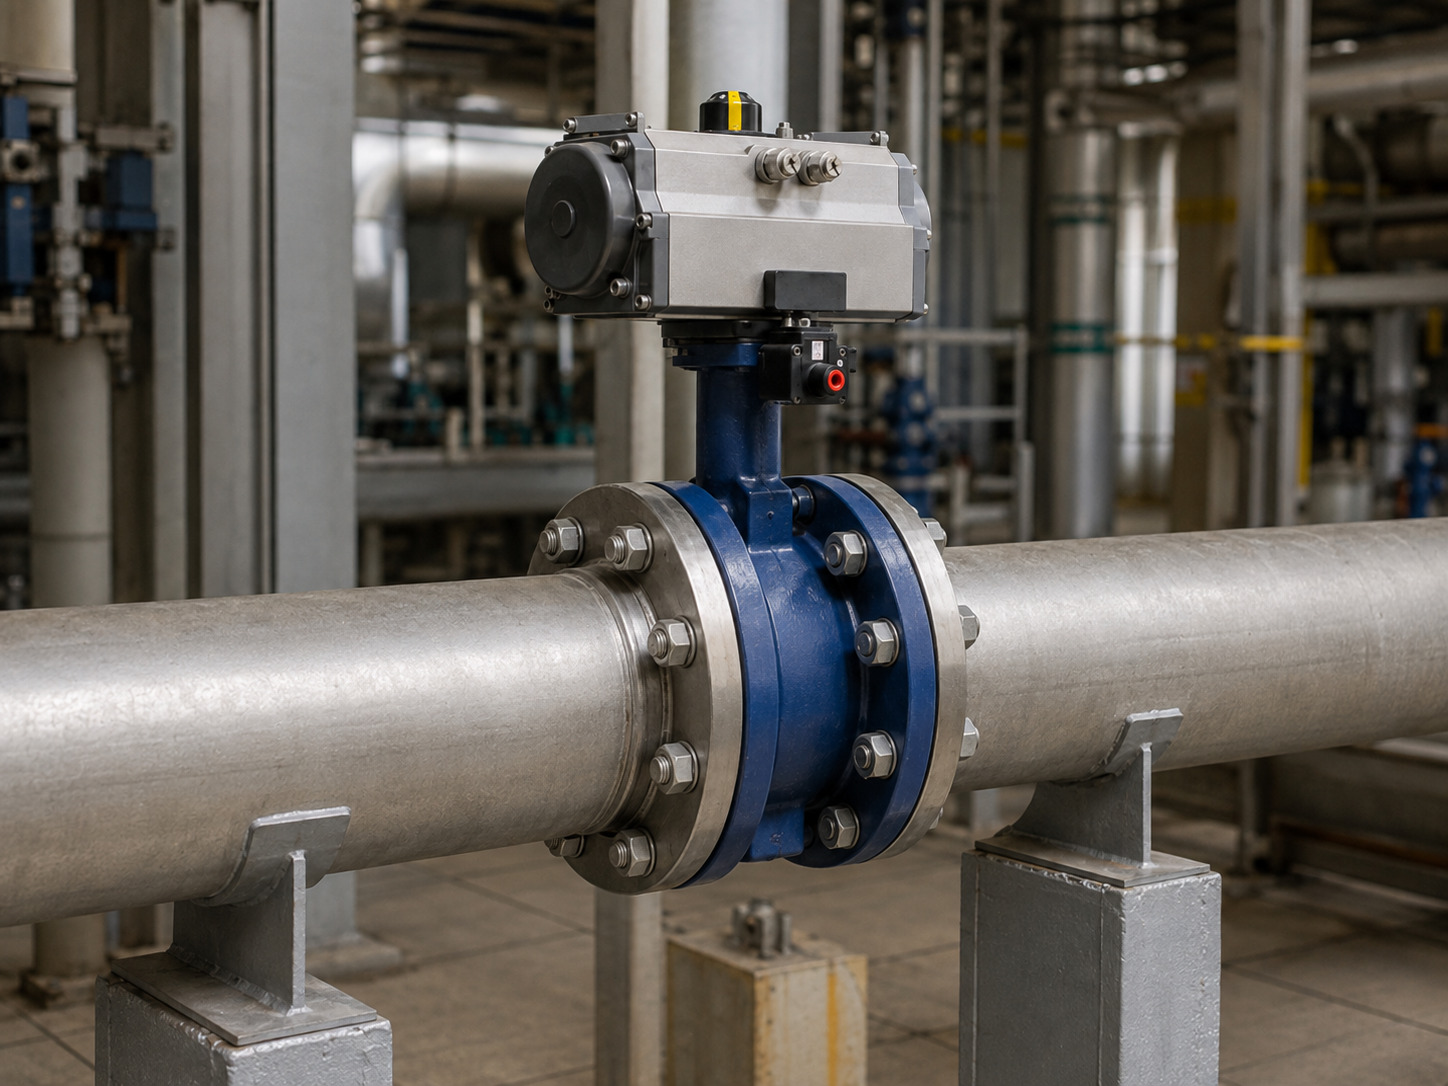
A butterfly valve flow curve shows how the valve’s flow capacity changes as the disc rotates, so you can translate an opening position into Cv or Kv and then evaluate flow or pressure drop for a defined operating case. It does not prove that 50% open produces 50% flow.
That distinction matters when a line-size valve is automated for throttling. A generic curve may look reassuring, yet the installed valve can hunt near one end of travel or run out of response near the other. Read the curve as valve-specific data and combine it with actual system pressures.
RUITO offers industrial butterfly valve configurations with different body, disc, seat, and offset designs. Those construction choices are one reason a single generic curve cannot represent every butterfly valve.
What a Butterfly Valve Flow Curve Actually Shows
A butterfly valve flow curve normally plots valve opening on the horizontal axis and hydraulic capacity on the vertical axis. The first task is to identify exactly what both axes mean before reading any point.
The horizontal axis may show disc angle from closed, percent of mechanical travel, or a controller command. The datasheet must define its angle convention. The vertical axis may show absolute Cv, absolute Kv, percent of rated coefficient, or flow measured under a stated test condition.
Four quantities that are not interchangeable
Keep these quantities separate:
- Disc travel is the valve’s mechanical position.
- Open area is the free area around the disc.
- Cv or Kv expresses hydraulic capacity under reference conditions.
- Actual flow depends on that coefficient and the installed pressure differential.
A chart marked “percent flow” is easy to misuse. Confirm whether it means percent of maximum test flow at constant pressure drop, percent of Cvmax, or calculated system flow.
Why Percent Open Does Not Equal Percent Flow
Percent open does not equal percent flow because disc geometry changes the restriction nonlinearly, while the pressure drop across an installed valve also changes with system demand. A 10% increase in travel can therefore produce a small flow change at one position and a much larger change at another.
Near closed, narrow passages can create jets, noise, erosion, vibration, or cavitation risk in liquid service. Near fully open, added travel may provide little useful capacity. The transition points depend on valve size, disc profile, seat, shaft geometry, and the system.
Do not assign a curve family from the valve name alone
Butterfly-valve curves are often described as equal-percentage, modified equal-percentage, quick-opening, or S-shaped. None of those labels should be assumed solely because the valve is a butterfly design. Use the model-specific curve and note whether it is an inherent curve measured at constant pressure drop or an installed curve calculated for a particular circuit.
Do not apply a normalized curve from one valve family to a different disc, seat, bore, or offset geometry.
Read the Curve Without Misreading the Axes
Read a butterfly valve flow curve by identifying the exact valve, decoding both axes, and locating the capacity required at minimum, normal, and maximum flow. The following sequence turns a chart into an engineering check.
- Match the curve to the valve. Confirm manufacturer, series, nominal size, pressure class, disc, seat, and flow direction.
- Confirm the opening convention. Determine whether 0 means closed, whether 100% travel equals the specified maximum disc angle, and whether mechanical stops limit usable travel.
- Identify the capacity unit. Separate Cv, Kv, percent Cvmax, and measured flow. Record the fluid and pressure-drop basis if the chart reports flow directly.
- Use tabulated points when available. A graph shows shape, but a supplier table is better for calculations. Do not infer false precision from a thick curve line.
- Mark three operating cases. Plot minimum, normal, and maximum required capacity instead of checking only the design maximum.
- Record the limits. Note missing data, test piping, interpolation rules, and warnings about cavitation, velocity, or torque.
Different chart formats answer different questions, as the table below shows.
| Curve format | What you can read | What it cannot prove by itself |
|---|---|---|
| Cv or Kv versus disc angle | Valve capacity at each tested position | Actual installed flow without pressure data |
| Percent Cvmax versus travel | Relative curve shape | Absolute capacity or pressure loss |
| Flow versus opening at fixed pressure drop | Test flow at the stated condition | Performance at a different differential pressure |
| Installed flow versus command | Expected circuit response for one model | Universal behavior in another piping system |
Use relative curves to compare shape, but use model-specific absolute coefficients for sizing.
Convert Cv into a Flow or Pressure-Drop Check
Convert the curve into a liquid-service check by combining Cv at the chosen angle with flow, specific gravity, and valve differential pressure. For a first-pass calculation in U.S. customary units:
Q = Cv × sqrt(ΔP / SG)
Rearranging gives:
Required Cv = Q × sqrt(SG / ΔP)
ΔP = (Q / Cv)² × SG
Here, Q is U.S. gpm, ΔP is valve pressure drop in psi, and SG is liquid specific gravity. ISA’s discussion of choked flow explains that once liquid flow chokes, lowering downstream pressure no longer produces the predicted increase.
The example below is an illustrative screening calculation for a water-like liquid with SG = 1.0. The available valve pressure drop is an input from the system model, not a recommended value.
| Operating case | Flow, gpm | Available ΔP, psi | Required Cv |
|---|---|---|---|
| Minimum | 400 | 2 | 283 |
| Normal | 800 | 3 | 462 |
| Maximum | 1,200 | 4 | 600 |
Locate Cv 283, 462, and 600 on the selected valve’s curve. All three points must fall within its documented range and leave a usable control span. The minimum point must not depend on seat leakage, excessive jetting, or finer positioning than the actuator can deliver.
For more detail, use the butterfly valve pressure-drop calculation. Do not extend the simple liquid formula to gas, steam, flashing or choked liquids, non-Newtonian media, slurries, or liquid-solid service. IEC 60534-2-1 defines separate sizing scopes and important limits.
From the Inherent Curve to the Installed Curve
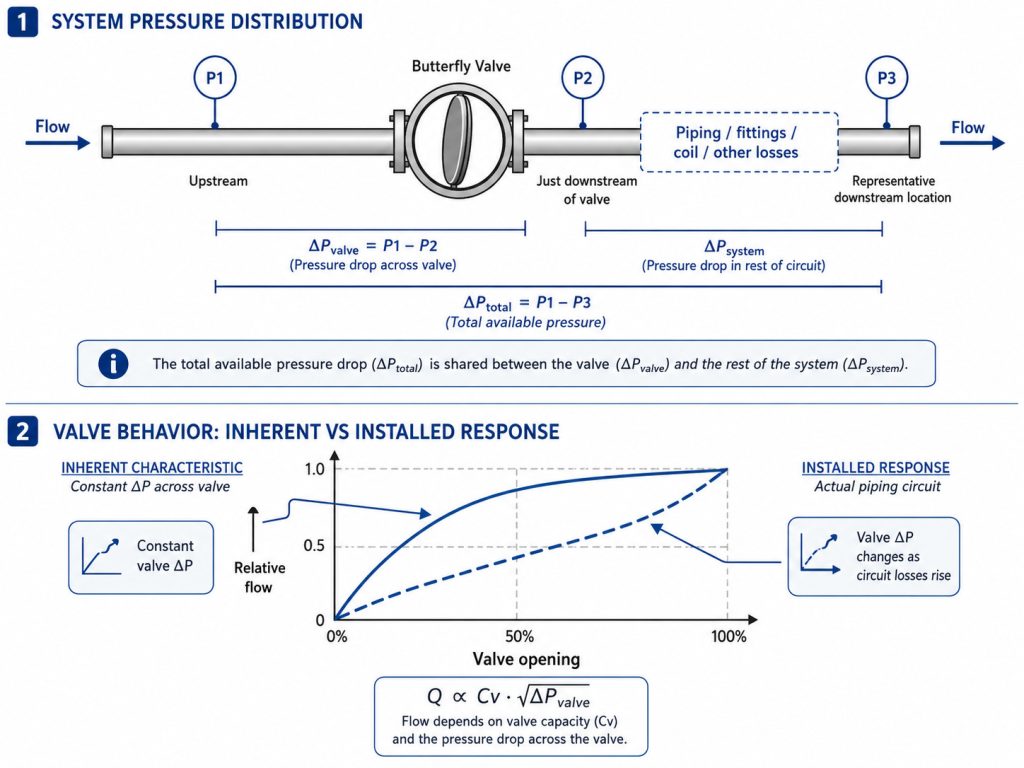
The installed curve differs from the inherent curve because the pressure drop across the valve is not constant in a real system. As flow rises, pipes, fittings, heat exchangers, strainers, and other equipment consume more of the available pressure, so the valve receives a different differential pressure at each operating point.
Valve authority describes the valve’s influence over the controlled circuit. For hydronic applications, ASHRAE’s valve guidance explains that low authority distorts the characteristic and identifies 0.25 to 0.50 as a usual balance between control and energy performance. That is not a universal process-service rule.
An oversized valve may pass maximum flow easily but spend normal operation near a difficult end of travel. A smaller valve can improve control yet waste pump head or raise cavitation risk. Evaluate the valve and system curves together, then check the complete modulating butterfly valve package.
Match the Curve to the Operator and Piping
Match the hydraulic curve to the operator and piping because commanded position is not automatically true disc angle, and catalog test conditions may not match the installed approach flow. These two gaps explain many apparent curve failures in the field.
Verify actual angle, not only the control signal
A controller output does not prove the same disc travel. Check calibration, linkage, positioner feedback, stem coupling, gearbox backlash, and both travel stops. Tie the indicators to verified disc positions, not merely motor rotation or handwheel turns.
For gear-operated valves, review the gearbox selection and travel-stop checks together with the flow curve. Backlash and incorrect stops can reduce repeatability even when the hydraulic curve itself is valid.
Account for disturbed inlet flow
Elbows, pumps, tees, reducers, and short straight runs can create asymmetric velocity across the disc. Ask how the curve was tested, including pipe inside diameter, reducers, pressure taps, and flow direction, then compare those conditions with the project layout.
Use a Three-Point Acceptance Test Before Approval
Approve a throttling butterfly valve only after minimum, normal, and maximum operating cases pass hydraulic, mechanical, and control checks. This is more reliable than choosing line size and verifying only full-open Cv.
Your RFQ or technical submittal should request:
- Cv or Kv by opening angle for the exact valve series, size, disc, seat, and flow direction;
- the angle convention, test medium, temperature, piping arrangement, and pressure-drop basis;
- minimum, normal, and maximum flow with corresponding inlet and outlet pressures;
- liquid vapor pressure or complete gas and steam properties where relevant;
- valve pressure class, shutoff differential pressure, materials, and leakage requirement;
- torque versus angle, actuator sizing basis, positioner resolution, deadband, and travel-stop settings;
- the additional recovery, choking, or piping-geometry coefficients required by the applicable sizing method.
If field flow disagrees with the prediction, verify the valve identity and curve revision first. Then measure actual disc position and differential pressure, confirm fluid properties, check pressure taps, and inspect nearby fittings or reducers.
Frequently Asked Questions
Is a butterfly valve flow curve linear?
Usually not across the full travel. The shape depends on disc geometry, seat, bore, size, and test conditions, so use the model-specific curve instead of assuming a universal linear or equal-percentage response.
Can I estimate flow from handle position alone?
No, not reliably. Handle or actuator position gives travel; you still need the valve’s Cv or Kv at that position and the actual pressure drop across the valve.
Does Cv stay constant as a butterfly valve opens?
No. Cv changes with disc angle because the disc changes the effective restriction and pressure recovery. A full-open Cv is therefore insufficient for a valve that will modulate.
What if a supplier provides only full-open Cv?
Full-open Cv may support preliminary isolation-service screening, but it does not establish throttling performance. Request coefficient data by opening angle before approving a modulating duty.
Why can field flow differ from the catalog curve?
Field flow can differ because valve differential pressure, fluid properties, actual disc angle, piping disturbances, reducers, and measurement locations differ from the catalog test basis. Verify those conditions before changing valve size.
Make the Curve a Verified Engineering Input
A useful butterfly valve flow curve connects a specific valve to three real operating points, a known pressure differential, and a verified disc position. Read the axes first, calculate required capacity at minimum, normal, and maximum flow, then check installed behavior, actuation, piping, and severe-service limits.
If you need a model-specific Cv or Kv review, send the service fluid, operating flows, inlet and outlet pressures, temperature, pipe layout, valve function, and preferred materials when you contact the RUITO Engineering Team. That data lets the discussion start with the curve your project actually needs.