
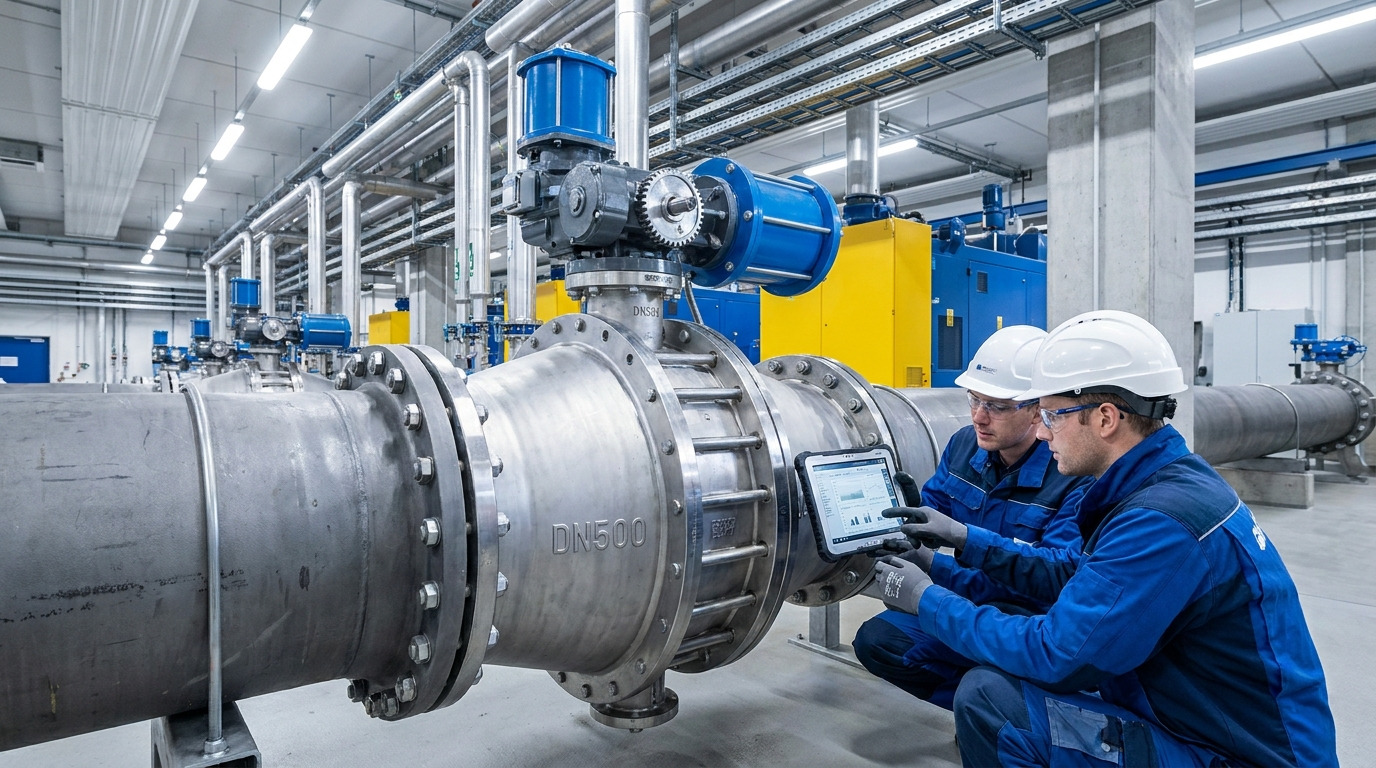
The ultimate butterfly valve cv curve is a detailed chart showing the exact flow coefficient at every degree of disk rotation, allowing you to size your pipeline accurately. You often face situations where improper sizing leads to severe pressure drops, ruining system efficiency. Guessing the flow rate damages equipment and halts production lines. The solution is applying the precise butterfly valve cv curve data to match your specific application requirements. Utilizing this information correctly gives you complete control over your fluid management.
What is a Butterfly Valve Cv Curve?
A butterfly valve cv curve is a specific graphical representation or data sheet that maps the flow capacity of the valve as the disk moves from fully closed to fully open. Knowing the exact butterfly valve cv curve helps you predict how much fluid passes through the pipeline at any given angle. It gives you the necessary metrics to avoid oversizing or undersizing your control units.
Why Does Flow Capacity Matter?
Here is the deal: selecting an incorrect size creates massive pressure losses and causes early mechanical wear. You need reliable data to prevent cavitation and reduce energy consumption across your industrial facility.
To maintain system health, review these primary metrics:
- Measure the specific gravity of the fluid.
- Track the maximum and minimum pressure drops.
- Confirm the standard operating temperature.
Key Takeaway: Referencing accurate flow metrics prevents unexpected mechanical failures and keeps your pipeline running smoothly.
| Opening Angle | Flow Capacity Level | Pressure Drop |
|---|---|---|
| 10 Degrees | Very Low | Severe |
| 45 Degrees | Moderate | Moderate |
| 90 Degrees | Maximum | Minimal |
This chart illustrates how the internal pressure drops drastically as the disk reaches the fully open position.
How Do You Calculate Flow Rate?
You calculate the flow rate by applying standard mathematical formulas that use the butterfly valve cv curve alongside specific gravity and pressure drop measurements. The butterfly valve cv curve data acts as the core multiplier in these equations to determine the actual volume passing through the system. Using accurate math prevents costly errors during the initial design phase.
Can You Measure the Variables Easily?
You might be wondering: what exact numbers do you need to plug into the formula? You must gather precise readings from your physical pipeline to get a usable calculation.
Make sure you collect the following data points:
- The inlet pressure before the disk.
- The outlet pressure after the fluid passes.
- The density of the liquid or gas.
Key Takeaway: Gathering precise field data guarantees that your flow calculations reflect real-world pipeline conditions.
| Fluid Type | Required Formula Input | Expected Output Unit |
|---|---|---|
| Water | Specific Gravity = 1.0 | Gallons Per Minute |
| Air | Specific Gravity = 1.0 | MMSCFD |
| Steam | Specific Volume | Pounds Per Hour |
The table outlines the required input values depending on the specific fluid media running through your pipes.
What Factors Change the Butterfly Valve Cv Curve?
The internal design of the disk, the seat material, and the physical pipeline dimensions directly change the butterfly valve cv curve. Every distinct style creates a unique butterfly valve cv curve because the physical obstruction in the fluid path varies. Recognizing these differences helps you pick the right model for heavy industrial tasks.
Do Material Choices Affect Performance?
What is the real story: the thickness of the disk and the type of rubber or metal seat alter the flow path significantly. A thicker disk creates more drag, which immediately lowers the maximum flow coefficient available at full open.
Consider these physical variables during selection:
- The aerodynamic shape of the internal disk.
- The thickness of the sealing ring.
- The diameter of the central shaft.
Key Takeaway: The physical geometry of the internal components dictates the total volume of fluid the unit can handle.
| Component | Design Variation | Flow Impact |
|---|---|---|
| Disk | Flat vs. Aerodynamic | High |
| Shaft | Centered vs. Offset | Moderate |
| Seat | Resilient vs. Metal | Low |
This breakdown shows how different physical parts create varying levels of resistance in the flow path.
How Do Different Openings Alter Flow?
Different disk angles alter the flow by physically restricting the available space inside the pipe, which is mapped by the butterfly valve cv curve. As you rotate the handle, the butterfly valve cv curve demonstrates how the flow area expands or shrinks. The change is most noticeable in the middle range of the rotation.
Is the Middle Range Hard to Control?
This is where it gets interesting: the flow rate jumps rapidly when the disk moves between thirty and sixty degrees. You have to tune your actuators carefully in this zone to maintain steady output.
Keep these operational ranges in mind:
- Zero to twenty degrees offers minimal flow.
- Thirty to sixty degrees provides rapid capacity changes.
- Seventy to ninety degrees yields maximum throughput.
Key Takeaway: Understanding the specific rotation zones allows operators to program actuators for smoother fluid management.
| Rotation Zone | Flow Characteristic | Control Difficulty |
|---|---|---|
| 0-20 Degrees | Barely open | Hard to stabilize |
| 30-60 Degrees | Rapid increase | Requires precision |
| 70-90 Degrees | Near full capacity | Easy to maintain |
This table highlights the operational zones and the level of precision needed to maintain steady pipeline operations.
Why is the Butterfly Valve Cv Curve Not Linear?
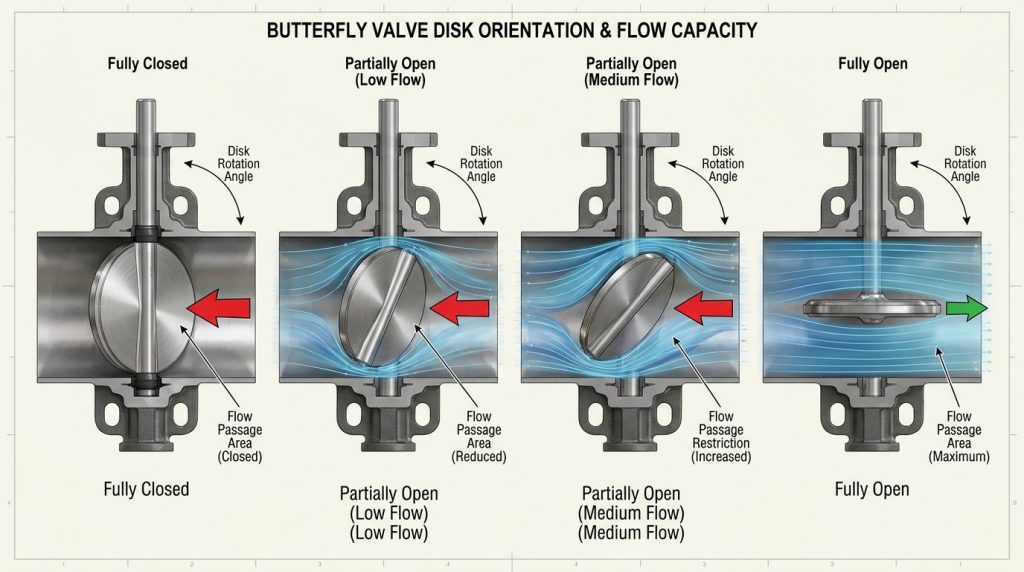
The shape of the disk causes a geometric obstruction that makes the butterfly valve cv curve completely non-linear. You cannot simply divide the butterfly valve cv curve by half to find the flow rate at forty-five degrees. This geometric reality means you must consult the exact manufacturer charts for every position.
How Does Geometry Block the Liquid?
Look at it this way: the circular disk blocks a disproportionate amount of the pipe area when it first begins to open. As it turns parallel to the flow, the available open space grows exponentially rather than at a steady rate.
You will notice these non-linear traits:
- A ten percent turn does not equal ten percent flow.
- The highest flow increase happens in the middle positions.
- The last few degrees add very little extra capacity.
Key Takeaway: Relying on exact manufacturer tables instead of estimating percentages prevents disastrous sizing mistakes.
| Disk Angle | Percentage of Total Open | Flow Coefficient % |
|---|---|---|
| 30 Degrees | 33% | 15% |
| 60 Degrees | 66% | 55% |
| 90 Degrees | 100% | 100% |
The percentages in this chart prove that the physical rotation angle does not match the actual flow output.
How Do You Read Offset Valve Charts?
You read offset valve charts by locating your specific pressure class and finding the matching size and angle columns. Since offset models have thicker hardware, their butterfly valve cv curve is generally lower than standard models. Reading these charts correctly requires knowing your exact system pressure class.
Are High-Pressure Charts Different?
Ready for the good part: higher pressure ratings require thicker internal metal, which directly lowers the flow capacity compared to low-pressure models. You must reference the exact table for Class 300 or Class 600 to avoid severe calculation errors.
Follow these steps when reading the data:
- Verify the specific pressure class of your system.
- Match the exact pipe diameter on the left column.
- Track horizontally to find the coefficient at your required angle.
Key Takeaway: Always match the pressure class on the data sheet to your physical pipeline to guarantee correct sizing.
| Pressure Class | Internal Thickness | Relative Flow Capacity |
|---|---|---|
| Class 150 | Standard | High |
| Class 300 | Thicker | Medium |
| Class 600 | Very Thick | Low |
This data shows how increasing the physical strength of the internal components reduces the total fluid passing through.
What Shifts High-Performance Valve Cv?
Upgraded seating structures and offset shaft designs shift the high-performance butterfly valve cv curve away from standard resilient-seated models. By moving the shaft away from the center, the butterfly valve cv curve reflects less flow restriction at full open. These high-performance units deliver different flow characteristics suited for demanding chemical processing.
Does the Offset Shaft Improve Flow?
Truth to be told: moving the shaft out of the direct fluid path creates a smoother internal bore, which increases the maximum capacity. This minor structural change provides a major advantage when you need to maximize your system output.
The offset design provides these specific benefits:
- Less turbulence immediately behind the disk.
- A more streamlined fluid path at full open.
- Reduced wear on the sealing components.
Key Takeaway: Choosing a high-performance offset model improves the maximum flow capacity while extending the life of the internal seals.
| Design Type | Shaft Position | Flow Efficiency at 90° |
|---|---|---|
| Concentric | Center | Standard |
| Double Offset | Slightly off-center | Improved |
| Triple Offset | Completely clear | Maximum |
This structural comparison reveals why offset designs dominate high-pressure and high-efficiency industrial applications.
How Does Seat Design Impact Flow Rate?
The physical profile of the seat determines how much area is left for the fluid, directly altering the butterfly valve cv curve. A thick rubber seat intrudes into the pipe, which slightly lowers the maximum butterfly valve cv curve values. Conversely, a thin metal seat provides a larger internal diameter and higher flow.
Can Rubber Seats Restrict the Pipeline?
Consider this: resilient seats must be thick enough to compress against the disk, and that extra material takes up valuable space inside the pipe. Metal seats do not need this thick profile, so they naturally allow more liquid to pass.
When evaluating seat types, check these factors:
- The internal diameter of the seat ring.
- The material flexibility under high pressure.
- The required closing torque for the actuator.
Key Takeaway: The physical thickness of your sealing material plays a direct role in calculating your maximum system flow.
| Seat Material | Profile Thickness | Flow Restriction Level |
|---|---|---|
| EPDM Rubber | Very Thick | Noticeable |
| PTFE Lined | Moderate | Average |
| Solid Metal | Very Thin | Minimal |
This material guide demonstrates how standard rubber sealing rings consume more internal space than metallic alternatives.
When Should You Use Cv for System Sizing?
You should use the butterfly valve cv curve data during the initial design phase to select the exact diameter that meets your target flow rate. Relying on the butterfly valve cv curve prevents you from installing a unit that is too small, which causes system backups. It also prevents oversizing, which makes precise throttling impossible.
Is Throttling Sizing Different from Shutoff?
Let that sink in: if you only need on and off isolation, the maximum open capacity is all that matters. But if you plan to throttle and control the flow, you must calculate the capacity across the middle rotation angles.
Use these guidelines for sizing:
- Use the fully open value for pure isolation tasks.
- Analyze the thirty to sixty-degree range for control tasks.
- Check the minimum flow requirement at ten degrees.
Key Takeaway: Your intended application—whether simple isolation or complex throttling—dictates which part of the data chart you must use.
| Application Type | Critical Data Range | Primary Goal |
|---|---|---|
| Isolation Only | 90 Degrees | Maximize throughput |
| Throttling Control | 30-60 Degrees | Maintain stability |
| Bleed Systems | 10-20 Degrees | Prevent vibration |
This chart helps you decide which specific section of the data sheet is most relevant to your daily pipeline operations.
What are the Limits of Pressure Drop?
The data becomes unreliable if the pressure drop exceeds half of the inlet pressure, making the butterfly valve cv curve invalid for compressible fluids. High pressure drops cause flashing or cavitation, which the standard butterfly valve cv curve cannot accurately predict. You must keep the system within safe velocity limits to use these charts effectively.
How Does Cavitation Destroy Equipment?
Here is the deal: when liquid drops below its vapor pressure inside the pipe, bubbles form and violently collapse, destroying the metal internals. Standard flow charts do not account for this extreme physical reaction, so you must calculate your pressure drops carefully.
Avoid these dangerous operational conditions:
- Pushing compressible gases beyond a fifty percent pressure drop.
- Ignoring the warning signs of internal vibration.
- Operating continuously near the cavitation threshold.
Key Takeaway: Keeping your pipeline pressure drop within safe margins protects your hardware from destructive flashing and cavitation.
| Fluid Condition | Pressure Drop Limit | Risk of Exceeding Limit |
|---|---|---|
| Incompressible Liquid | Low | Cavitation damage |
| Compressible Gas | < 50% of Inlet | Sonic velocity limits |
| Two-Phase Mixture | Variable | Unpredictable flow |
This final table outlines the strict physical boundaries you must respect to keep your calculated flow data accurate and your pipeline safe.
By providing you with exact flow measurements at every angle, these data sheets eliminate the guesswork in pipeline engineering. We solve your most complex fluid control challenges by delivering precision-engineered equipment backed by verified performance data. Whether you need standard resilient models or high-performance offset units, we have the technical resources to support your infrastructure. Reach out and contact us today to equip your facility with dependable components. Building reliable fluid control systems is our core mission, and we stand ready to power your industrial success.
FAQ
Q1: Can I calculate the flow rate at forty-five degrees by dividing the maximum capacity in half?
No, you cannot use simple division for these calculations. The geometric shape of the disk creates a non-linear flow path, meaning the capacity does not increase proportionately with the angle of rotation.
Q2: What’s the best way to choose between a resilient seat and a metal seat for high flow?
A metal seat is the best option if you need maximum flow capacity. Metal seats have a thinner internal profile compared to thick rubber seats, providing a larger bore for fluid to pass through.
Q3: How do I know if my pressure drop is too high for the standard charts?
Your pressure drop is too high if it exceeds fifty percent of the inlet pressure for gases. At this point, compressible fluids reach sonic velocity limits, making standard flow coefficient formulas completely invalid.
Q4: Can I use offset valve charts for my standard concentric valves?
No, you must use the specific chart designed for your exact valve type. Offset valves have thicker internal shafts and different seating angles, which create completely different flow characteristics than concentric models.
Q5: What’s the best rotation range for stable throttling control?
The thirty to sixty-degree range provides the most stable throttling control. Operating below thirty degrees causes unstable vibrations, while operating above sixty degrees yields very little change in actual fluid volume.