

Butterfly valve torque standards outline the precise testing methods required to measure the rotational force needed to open or close the disc under specific pressures. Fluid control systems often fail because engineers underestimate the seating friction, causing the actuator to stall and halt production. The resulting downtime ruins schedules and inflates maintenance costs rapidly. A reliable butterfly valve torque chart solves this issue by providing exact force requirements based on line pressure and valve size.
Why is a butterfly valve torque chart important for design?
A butterfly valve torque chart is important for design because it dictates the exact size of the pneumatic or electric actuator required to operate the system. Engineers rely heavily on this data to ensure the disc moves smoothly against the sealing materials. When you consult a butterfly valve torque chart, you eliminate the guesswork associated with friction coefficients.
Using accurate data prevents both undersizing, which causes stalling, and oversizing, which wastes money. Proper sizing protects the stem from shearing forces during rapid actuation cycles. You save significant capital by aligning the mechanical requirements precisely with the component specifications.
How do engineers apply this data?
Here is the deal: applying the data correctly requires matching the media characteristics with the valve seat material. You cannot just pick the highest number and assume the system will run safely.
- Match the differential pressure to the chart.
- Verify the media temperature and state.
- Confirm the seat material elasticity.
What is the real story? The physical properties of the process media alter the required rotational force significantly. If you pump dry gas instead of lubricating oil, the friction against the rubber liner increases.
Key Takeaway: Correct application of torque specifications ensures your automated valves operate reliably without overstressing the mechanical linkages.
| Size (DN) | Pressure (PN10) | Torque (Nm) |
|---|---|---|
| 50 | 10 Bar | 15 |
| 100 | 10 Bar | 45 |
| 150 | 10 Bar | 110 |
| 200 | 10 Bar | 200 |
The data demonstrates how rotational force requirements scale exponentially as the internal diameter increases.
How does a butterfly valve torque chart define standards?
A butterfly valve torque chart defines standards by establishing a uniform baseline for seating, running, and unseating forces across different manufacturers. These reference points ensure that every testing facility evaluates performance using identical parameters. Reading a butterfly valve torque chart allows quality control teams to verify if a product meets international safety codes.
Standardized values prevent mismatched components during industrial plant upgrades. When a facility replaces a manual handwheel with a pneumatic actuator, the baseline data ensures the new equipment functions correctly. Consistent metrics maintain operational safety in high-pressure environments.
What happens during standardization?
Ready for the good part? Manufacturers conduct rigorous hydrostatic testing to find the absolute minimum and maximum force required. They push the components to their physical limits to find the breaking points.
- Testing at zero pressure to find basic friction.
- Testing at maximum working pressure.
- Testing after thousands of operational cycles.
You might be wondering: why do we need multiple tests? Material wear changes the friction coefficient over time, so initial testing alone is insufficient.
Key Takeaway: Standardized metrics provide a universal language for engineers to select safe and functional fluid control components.
| Standard | Test Media | Duration |
|---|---|---|
| API 609 | Water | 2 Min |
| ISO 5211 | Air | 1 Min |
| AWWA C504 | Water | 5 Min |
The table highlights how different industrial codes specify varying test media and durations to validate performance.
When should you use a butterfly valve torque chart for tests?
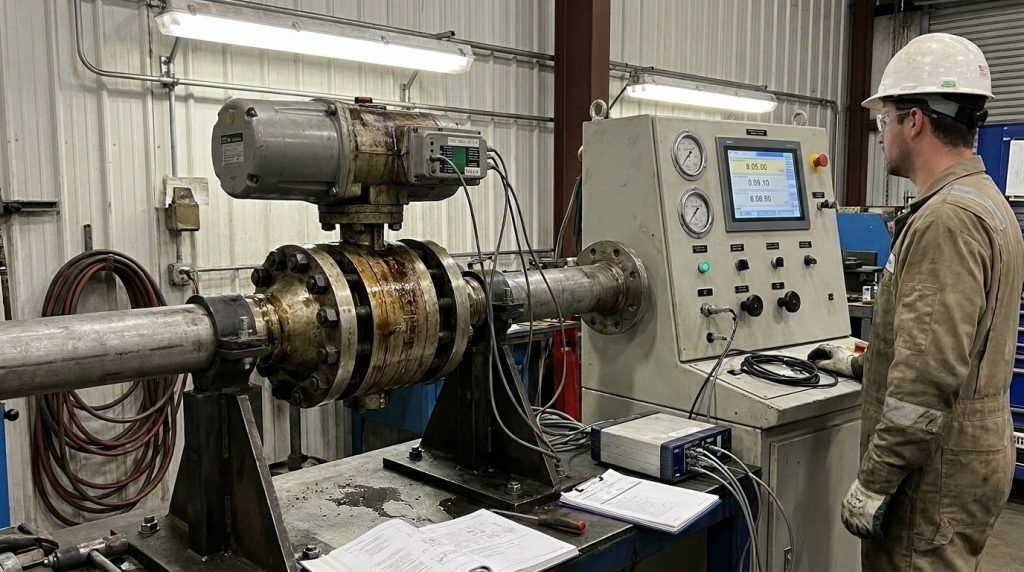
You should use a butterfly valve torque chart for tests during the initial commissioning phase and during routine maintenance inspections. Comparing actual operating force against the baseline data reveals hidden mechanical issues before they cause catastrophic failure. A butterfly valve torque chart serves as the ultimate reference point for system health.
Checking the values periodically helps you identify seat swelling, stem corrosion, or foreign debris trapped in the pipeline. If the measured force exceeds the chart specifications by twenty percent, you must schedule an immediate inspection.
Are regular checks necessary?
Truth be told: skipping these mechanical checks often leads to severe pipeline ruptures. Actuators will continue to push until the stem shears or the disc cracks.
- Verify force during quarterly shutdowns.
- Check values after media changes.
- Record metrics after severe pressure spikes.
This is where it gets interesting: smart positioners can now read these values digitally in real-time. You no longer need to rely solely on manual torque wrenches to verify the data.
Key Takeaway: Routine comparison against the baseline data prevents unexpected mechanical failures and extends the operational life of the pipeline.
| Condition | Action Required | Priority |
|---|---|---|
| Matches Chart | Continue Operation | Low |
| 10% Increase | Schedule Lubrication | Medium |
| 25% Increase | Replace Seat | High |
This breakdown shows how percentage increases in rotational force dictate the urgency of maintenance responses.
What factors alter data in a butterfly valve torque chart?
Factors that alter data in a butterfly valve torque chart include process temperature, fluid lubricity, and prolonged periods of inactivity. The baseline numbers assume ideal conditions, but real-world pipelines present harsh environments that modify material friction. Adjusting your butterfly valve torque chart calculations for these variables is critical for safe automation.
Dry gases and abrasive slurries strip away natural lubrication, causing the disc to drag aggressively against the rubber liner. Extreme temperatures harden resilient seats, forcing the actuator to work much harder to achieve a tight shut-off.
Do environmental factors matter?
Listen to this: a valve left closed for six months will require significantly more force to open than one cycled daily. The rubber liner literally bonds to the metal disc over time.
- High temperatures increase rubber stiffness.
- Dry media increases surface friction.
- Infrequent operation causes seat sticking.
Think about it: if you size an actuator based solely on clean water testing, it will fail when used for dry powder transport.
Key Takeaway: Always apply safety factors to your baseline data to compensate for severe environmental and operational variables.
| Variable | Multiplier | Effect |
|---|---|---|
| Dry Gas | 1.30 | High Friction |
| Slurry | 1.50 | Abrasive Wear |
| Lubricating Oil | 0.80 | Low Friction |
Applying these multipliers ensures your actuator sizing remains accurate regardless of the process fluid.
Can a butterfly valve torque chart prevent system failures?
A butterfly valve torque chart can prevent system failures by ensuring the selected actuator provides enough force to overcome emergency pressure spikes. Accurate sizing guarantees that automated systems can isolate pipeline sections rapidly during a critical event. Relying on a butterfly valve torque chart is the most effective way to design fail-safe mechanisms.
If an actuator is undersized, it will stall halfway through the closing cycle when the fluid velocity is highest. This creates severe turbulence and vibration that can tear the piping supports from the facility walls.
How do we guarantee safety?
The bottom line is: safety relies entirely on accurate mechanical calculations. You cannot compromise on sizing when dealing with volatile chemicals or high-pressure steam.
- Select spring-return actuators for power loss.
- Include a minimum safety margin of 20%.
- Test the assembly under maximum flow.
Let me explain: the dynamic torque generated by fluid rushing past a partially open disc is often higher than the seating friction.
Key Takeaway: Proper sizing calculations directly translate to increased safety and reliability during emergency shutdown sequences.
| Failure Type | Root Cause | Prevention |
|---|---|---|
| Stem Shear | Oversized Actuator | Chart Matching |
| Valve Stall | Undersized Actuator | Safety Factor |
| Seat Tear | Excessive Velocity | Flow Control |
Matching the root causes with preventative measures highlights the importance of accurate engineering data.
How to calculate values for a butterfly valve torque chart?
To calculate values for a butterfly valve torque chart, engineers multiply the expected differential pressure by the specific friction coefficient of the seat material. This calculation requires physical testing with dynamometers to validate the mathematical models. Creating a new butterfly valve torque chart involves recording the seating, dynamic, and bearing forces separately.
The seating force typically represents the highest value, as the disc must compress the rubber liner to create a seal. Once the disc leaves the seat, the required force drops significantly until the hydrodynamic forces take over at high flow rates.
What is the testing procedure?
Here is the secret: testing facilities use automated rigs to cycle the components thousands of times while recording the metrics digitally.
- Install the component in the test loop.
- Apply incremental pressure steps.
- Measure the peak force at each step.
Why does this matter? Manual calculations often miss the subtle variations caused by different manufacturing tolerances in the bearing housings.
Key Takeaway: Combining theoretical calculations with empirical testing produces the most reliable specifications for industrial use.
| Component | Force Contribution | Peak Point |
|---|---|---|
| Seat Friction | 60% | 0 Degrees (Closed) |
| Bearing Friction | 20% | Continuous |
| Dynamic Flow | 20% | 70 Degrees |
This breakdown illustrates which mechanical factors contribute most heavily to the overall operating force.
Does pressure affect a butterfly valve torque chart reading?
Pressure directly affects a butterfly valve torque chart reading by pushing the disc aggressively against the downstream side of the seat. Higher line pressures increase the mechanical friction exponentially, requiring a much larger actuator to move the stem. A standard butterfly valve torque chart always lists values in relation to specific differential pressure ratings.
When the differential pressure across the disc increases, the bearings must support a heavier side load. This bearing friction adds significantly to the total force required to rotate the stem smoothly.
How does pressure alter the seal?
Wait, there is more: the pressure actually helps seal the valve in certain offset designs, but it always makes the valve harder to open.
- Low pressure relies on rubber compression.
- High pressure uses fluid force for sealing.
- Differential pressure dictates actuator size.
It gets better: understanding this relationship allows engineers to select double-acting actuators that utilize the process pressure to assist in the operating cycle.
Key Takeaway: Always size your automation equipment based on the maximum possible differential pressure, not the normal operating pressure.
| Pressure Class | Max Rating | Actuator Type |
|---|---|---|
| PN10 | 10 Bar | Rack & Pinion |
| PN16 | 16 Bar | Scotch Yoke |
| PN25 | 25 Bar | Heavy Duty |
Selecting the appropriate actuator type based on the pressure class prevents mechanical binding and guarantees smooth operation.
Where to find a reliable butterfly valve torque chart?
You can find a reliable butterfly valve torque chart directly in the technical manuals provided by the original equipment manufacturer. Third-party testing laboratories also publish verified data for various industrial components. Always insist on a certified butterfly valve torque chart before integrating new products into a critical fluid control network.
Using generic charts found randomly online is dangerous because different brands use varying seat profiles and stem dimensions. A slight change in the rubber compounding can drastically alter the actual friction coefficient.
Why trust the manufacturer?
Here is a quick tip: manufacturers conduct specific tests on their exact product lines, making their data infinitely more accurate than generic tables.
- Request certified test reports.
- Verify the testing standards used.
- Check the date of the publication.
Consider this: using outdated or generic data invalidates your warranty and places your entire facility at risk of a major spill.
Key Takeaway: Sourcing engineering data directly from the manufacturer guarantees you are working with validated, brand-specific metrics.
| Source Type | Accuracy | Reliability |
|---|---|---|
| Manufacturer | Excellent | Verified |
| Lab Report | Excellent | Independent |
| Generic Web | Poor | Unsafe |
Relying on verified sources eliminates the engineering risks associated with unverified or generalized mechanical data.
Why update your butterfly valve torque chart regularly?
You must update your butterfly valve torque chart regularly because manufacturers continuously improve their seat designs and friction-reducing bearing materials. Modern vulcanization techniques have significantly reduced the force required to seal resilient seated components. Reviewing a recent butterfly valve torque chart ensures you take advantage of these efficiency upgrades.
Continuing to use outdated data means you will likely buy actuators that are much larger and more expensive than necessary. Staying current with engineering specifications lowers your capital expenditures for plant automation.
How often should you check?
Check this out: reviewing the technical specifications annually prevents your engineering team from over-specifying automation packages.
- Update files during procurement cycles.
- Ask suppliers for revised documents.
- Archive old charts to prevent confusion.
Truth is: materials science moves fast, and the rubber compounds used today are far superior to those used five years ago.
Key Takeaway: Keeping your technical references up to date prevents wasteful spending on oversized pneumatic or electric components.
| Component Year | Friction Level | Actuator Cost |
|---|---|---|
| 2015 | High | Premium |
| 2020 | Medium | Standard |
| 2025 | Low | Optimized |
The evolution of seating materials directly correlates with a reduction in required force and automation expenses.
How to align a butterfly valve torque chart with actuators?
To align a butterfly valve torque chart with actuators, you must cross-reference the required valve force against the output force of the actuator at your available air pressure. The available plant air pressure dictates exactly how much force a pneumatic cylinder can produce. Matching your butterfly valve torque chart numbers with the actuator curves requires careful attention to the safety factors.
If the chart says you need 100 Nm of force, you should select an actuator that outputs at least 120 Nm at the minimum air supply. This margin ensures the system works perfectly even if the compressor loses some efficiency.
What is the matching process?
Here is the catch: pneumatic output drops if plant air pressure fluctuates, so always calculate using the worst-case scenario.
- Determine the minimum plant air pressure.
- Find the valve requirement on the chart.
- Add a 20% to 30% safety margin.
Keep in mind: electric actuators do not suffer from air pressure drops, but they must be protected against voltage spikes during the startup phase.
Key Takeaway: Proper alignment of mechanical requirements with actuator output curves guarantees consistent automation performance.
| Air Supply | Valve Need | Actuator Output |
|---|---|---|
| 4 Bar | 100 Nm | 80 Nm (Fail) |
| 5 Bar | 100 Nm | 105 Nm (Risky) |
| 6 Bar | 100 Nm | 130 Nm (Safe) |
Understanding how air supply affects output prevents the installation of automated assemblies that stall under load.
What are the final steps for valve sizing success?
Mastering component sizing removes the unpredictability from fluid control engineering and secures your operations against sudden mechanical stops. We know that replacing sheared stems and burnt-out motors drains your maintenance budget unnecessarily. Our proven manufacturing protocols deliver precision-engineered components that match performance specifications perfectly.
You deserve fluid control systems that operate flawlessly cycle after cycle without constant adjustments. If you want to eliminate actuator sizing errors and optimize your piping network, contact us today for expert engineering support. Ruitoflow stands for uncompromising reliability, ensuring every turn of the disc secures your process efficiency.
FAQ
Q1: Can I calculate seating force without a chart?
No, you cannot safely estimate seating force without verified manufacturer data. Relying on guesswork ignores variables like rubber durometer, bearing friction, and dynamic flow resistance, leading to severe actuator undersizing.
Q2: What’s the best way to test operating torque?
The best way is to use a digital dynamometer on a hydrostatic test bench. This setup provides exact readings under simulated line pressure, capturing the peak forces required to unseat the disc accurately.
Q3: How do I know if my actuator is oversized?
You will notice the disc slamming into the seat too quickly, or the stem may eventually twist or shear. Oversized actuators apply excessive mechanical stress that degrades the internal components prematurely.
Q4: Can I rely on standard tables for high pressure?
No, standard tables often assume low-pressure water applications. High-pressure systems require specific calculations that account for the massive side-load applied to the bearings and the increased friction on the downstream seat.
Q5: What’s the best method to adjust packing friction?
The best method is to tighten the packing gland nuts evenly in a star pattern while monitoring the rotational resistance. Over-tightening stops leaks but drastically increases friction, potentially stalling your automated setup.