
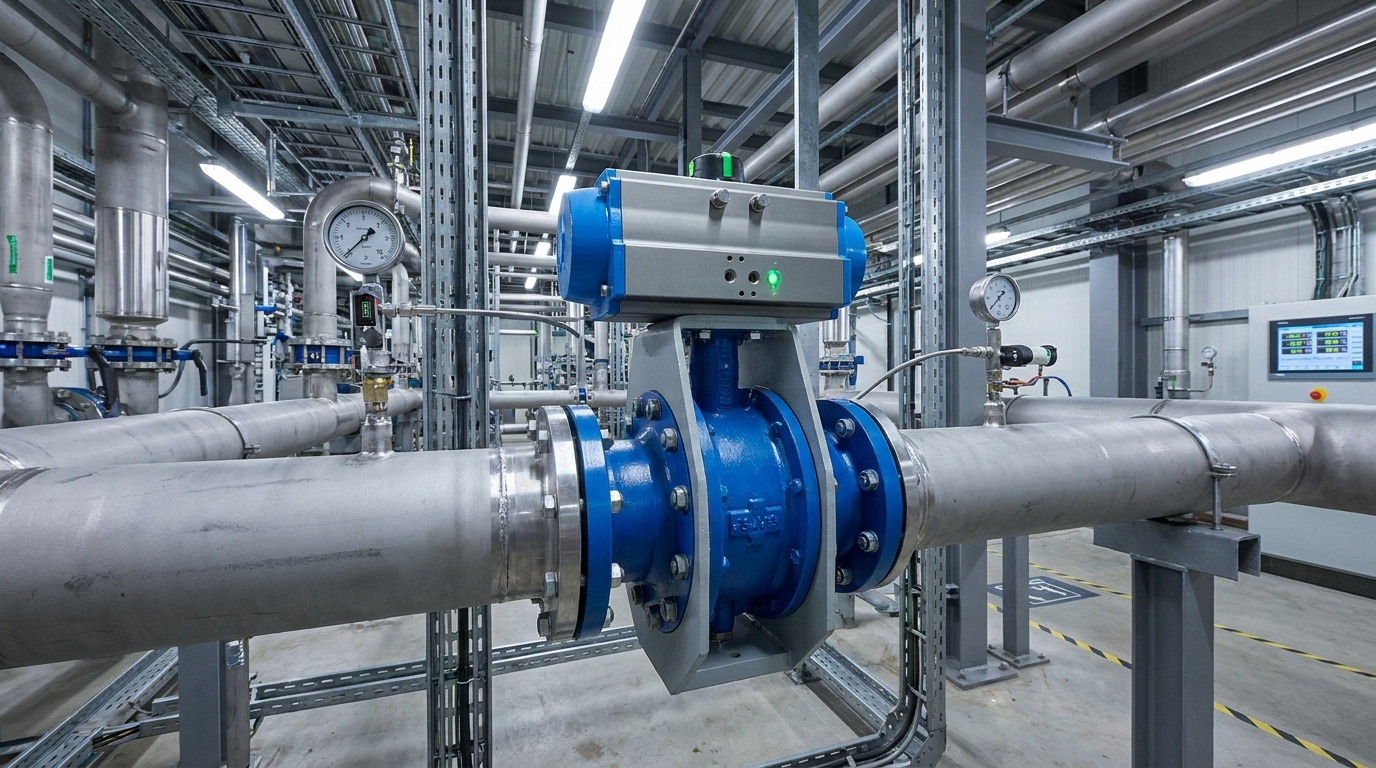
The flow characteristics of a butterfly valve describe how flow capacity changes as the disc rotates, while the installed response also depends on the pressure drop the piping system leaves across the valve. That is why 50% travel does not reliably mean 50% flow, and why a valve that looks acceptable at full-open Cv can still hunt, flatten out, or run out of control margin in service.
When a line-size valve is automated, connect disc angle, Cv or Kv, system pressure, and actual actuator movement instead of selecting from pipe size alone. If you are still defining the construction options, start with the industrial butterfly valve range and apply the checks below to the exact configuration.
What a butterfly valve flow curve actually represents
A butterfly valve flow curve represents capacity as a function of disc position under stated test conditions. The most useful form is an inherent Cv or Kv curve: pressure drop across the test valve is held constant while capacity is measured at multiple positions.
Cv is a capacity coefficient, not a flow rate by itself. The University of Florida’s valve-sizing guidance defines Cv as the U.S. gallons per minute of 60°F water that pass through a valve with a pressure drop of 1 psi. For a turbulent, nonflashing liquid, the simplified relationship is Q = Cv × sqrt(ΔP / SG), where Q is flow, ΔP is valve pressure drop, and SG is specific gravity.
The equation exposes the central point: disc position determines Cv, but the system determines the available ΔP. Gases, steam, viscous liquids, cavitating service, and two-phase flow require the appropriate sizing method.
Why disc rotation produces a nonlinear response
Disc rotation produces a nonlinear response because each degree of movement changes both the open area and the direction of the fluid around the disc. The shaft, disc edge, seat intrusion, body bore, and offset geometry all influence separation, velocity, pressure recovery, and torque.
Near the closed position, the remaining passages are narrow and a small angular change can create a large relative change from a very small starting capacity. Near the open position, the disc is already close to parallel with the flow, so more travel may add little capacity. The middle of travel is therefore often more useful for modulation, but no universal angle band should replace the exact manufacturer’s curve.
Do not confuse absolute and relative sensitivity. Doubling a small Cv may still create a small absolute flow change, while a modest percentage increase at high Cv can move much more fluid. Your controller responds to installed flow, not to the percentage printed beside the handle.
Three relationships govern the installed result
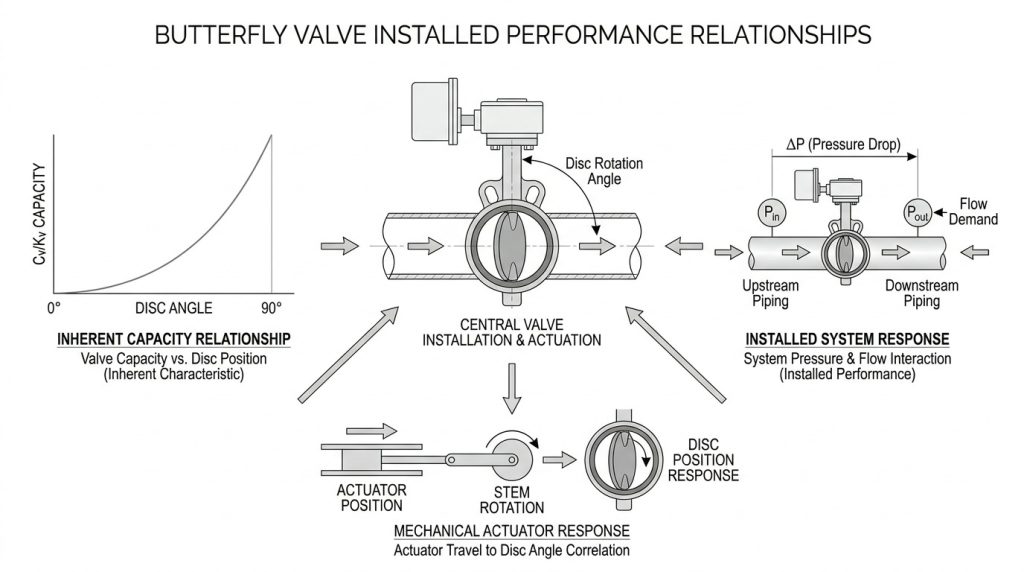
Installed performance is governed by the inherent capacity curve, the system pressure curve, and the relationship between the control signal and actual disc position.
Inherent capacity
The inherent curve maps disc angle to Cv or Kv at constant differential pressure. It belongs to a specific size and internal geometry. A full-open coefficient cannot show where the curve is steep, flat, or unsuitable for modulation.
Installed hydraulics
The installed curve maps disc position to real flow after pump head, static head, pipe friction, fittings, strainers, and process equipment have taken their share of pressure. As flow changes, the differential pressure across the valve usually changes too. An installed-flow and gain analysis therefore uses the required flow range together with upstream and downstream pressures rather than treating valve ΔP as a fixed guess.
Actual mechanical position
The motion chain maps controller output to actual shaft angle. Resolution, backlash, stiction, positioner setup, torque margin, and feedback can alter that relationship. A positioner cannot recover hydraulic authority, remove lost motion, or create capacity beyond the full-open limit.
Read a Cv curve without false precision
Read a Cv curve by confirming its axes, units, configuration, and test basis before interpolating an operating point. Retain the data table and review a detailed butterfly valve Cv curve analysis when the valve will modulate.
Use the following checks to prevent the most common interpretation errors.
| Curve item | What it should identify | Approval risk |
|---|---|---|
| Position axis | Disc angle in degrees or defined percent travel | Percent signal may not equal shaft angle |
| Capacity axis | Absolute Cv, absolute Kv, or normalized C/Cmax | A normalized curve cannot size the valve without full-open capacity |
| Configuration | Size, body pattern, disc, shaft, seat, and flow direction | A generic family curve may not represent the quoted valve |
| Test points | Measured positions and any fitted or interpolated segments | A smooth line can imply accuracy between sparse measurements |
| Test basis | Fluid, temperature, pressure taps, procedure, and flow regime | Data may be applied outside the conditions it can support |
The most dangerous mix-up is treating relative capacity as actual capacity. A point labeled 60% on a normalized curve means 60% of that configuration’s maximum coefficient, not 60% of pipeline flow and not necessarily 60% disc angle.
Build an operating envelope at three flow cases
A reliable operating envelope maps the minimum, normal, and maximum required flows to actual valve positions under their corresponding system pressures. This method tests controllability across the duty instead of proving only that the valve can pass maximum flow.
- Define each case with flow rate, fluid, temperature, density or specific gravity, viscosity where relevant, and inlet and outlet pressure.
- Determine the pressure drop available across the valve at each case. Include pump-head and system-loss changes; do not reuse one arbitrary ΔP. A project-specific butterfly valve pressure-drop calculation should replace a full-open rule of thumb.
- Calculate the required Cv or Kv for each case using a method appropriate to the fluid and flow regime.
- Map each required coefficient to the exact configuration-specific curve and record the resulting disc angle. If the normal point falls in a very steep or very flat part of the curve, review the valve size or style.
- Plot or tabulate installed flow versus position between the cases. Look for abrupt gain changes, little remaining response at maximum demand, or excessive sensitivity at minimum demand.
- Verify actuator resolution and dynamic torque under the same pressure conditions. Noise, vibration, cavitation indicators, seat exposure, and frequent reversals require deeper review.
The result should be an operating window, not a preferred angle. It should leave room to reduce and increase flow around normal demand without entering a weak or erratic response region.
Match the curve to the valve’s actual duty
The required curve detail depends on whether the valve will isolate, hold a fixed restriction, or modulate continuously. Calling every partially open valve a control valve leads to unnecessary analysis in some projects and insufficient analysis in others.
This table separates the three main decision levels.
| Duty | Minimum capacity evidence | Main acceptance question |
|---|---|---|
| On-off isolation | Full-open Cv or Kv and pressure-loss check | Can the valve pass design flow and meet shutoff and torque requirements? |
| Fixed balancing or coarse throttling | Coefficient at the intended locked position | Is the target flow repeatable with acceptable pressure loss and wear? |
| Continuous modulation | Full curve, installed operating points, gain trend, and actuator response | Can the loop change flow smoothly over the entire required range? |
A butterfly valve is attractive for large lines, compact installation, and moderate throttling. For fine low-flow control, severe pressure reduction, or wide stable rangeability, compare the installed result instead of forcing the rotary valve to fit. A focused globe valve versus butterfly valve comparison can help when precision matters more than compactness.
Approve the data package, not a generic curve
Approve a butterfly valve for control duty only when the submitted curve can be tied to the quoted construction and your operating cases. The data request should identify:
- valve size, pressure rating, body pattern, disc and shaft geometry, seat construction, and preferred flow direction;
- absolute Cv or Kv at multiple defined disc angles, plus the full-open value;
- whether the chart is measured, calculated, normalized, smoothed, or interpolated;
- test fluid, temperature, differential-pressure basis, pressure-tap arrangement, and applicable flow limitations;
- capacity test procedure, with the standard edition stated when a standard is claimed;
- dynamic torque by position and differential pressure, actuator sizing basis, minimum positioning step, deadband, and feedback method; and
- the project’s minimum, normal, and maximum operating points marked on the proposed curve.
The International Society of Automation identifies ANSI/ISA-75.02.01 within its work on control-valve capacity test procedures. A standards reference does not make every published curve interchangeable; it tells you what test basis to request and verify.
RUITO’s published butterfly valve portfolio spans DN25–DN3000 and PN10–PN25, with wafer, lug, and flanged connections, multiple seat and disc materials, and manual, electric, or pneumatic actuation. That range is precisely why the quoted configuration must carry its own capacity and torque evidence rather than borrowing a generic curve from another size or construction.
FAQ
Is the flow characteristic of a butterfly valve linear?
No, not across the complete stroke. A particular curve may approximate linear, modified, or equal-percentage behavior over part of its travel, but the exact shape depends on valve geometry and the installed pressure conditions.
Does flow direction change a butterfly valve’s characteristic?
It can. Symmetric concentric designs may be suitable for bidirectional service, while offset discs, seat orientation, shaft location, and pressure-recovery behavior can create a preferred direction; confirm the arrow and data sheet using the butterfly valve flow-direction guidance.
What is the difference between Cv and percent flow?
Cv is a capacity coefficient at a defined valve position and test basis; percent flow is a system result relative to a chosen flow reference. You need Cv, fluid properties, and valve pressure drop to connect the two.
Can a positioner fix an oversized butterfly valve?
Not by itself. A positioner can improve positioning and sometimes characterize the command, but it cannot move an operating point out of a poor hydraulic region, increase valve pressure authority, or restore high-end capacity margin.
Use the curve to preserve control margin
A reliable selection uses the exact configuration-specific Cv or Kv curve, the system pressure drop at each operating point, and verified actuator motion. This approach explains the valve’s inherent behavior, predicts its installed response, and exposes oversizing or weak control margin before the valve reaches the site.
For a project review, prepare the fluid data, minimum/normal/maximum flows, inlet and outlet pressures, pipe size, valve duty, materials, shutoff requirement, and actuator signal. Then contact our engineering team to evaluate the valve configuration and required curve against the real operating envelope.