
The relationship between fluid passage and disc rotation percentage defines how your system regulates pressure and capacity. Industrial plants constantly face severe pressure drops and damaged pipelines due to improper fluid control. You might watch your production halt entirely because a basic quarter-turn mechanism failed to regulate liquid properly. A clear grasp of the butterfly valve flow curve gives you precise tuning abilities to resolve these frustrating bottlenecks.
What Shapes The Core Butterfly Valve Flow Curve Pattern?
The physical geometry of the disc and the internal pipe diameter create the specific shape of the butterfly valve flow curve. Fluid faces varying degrees of obstruction as the disc rotates from a closed state to a fully open position. The resulting gap allows media to pass at changing velocities.
How Does The Disc Angle Restrict Media?
Here’s the deal, the disc acts as a solid barrier when positioned at a zero-degree angle. Small adjustments initially create narrow openings that only allow minimal media passage. You need to calculate the precise angle to hit your target output.
- Small angles create high resistance.
- Medium angles offer steady throughput.
- Wide angles produce minimal friction.
What Role Does The Seat Play?
Soft materials grip the disc edges tightly to form a complete seal when closed. Harder metal variants handle extreme heat but might alter the friction coefficient during early rotation. Key Takeaway: Selecting the right internal components directly dictates how your control system behaves. Proper hardware matching prevents unexpected turbulence during early operation phases.
| Angle | Resistance Level | Fluid Velocity |
|---|---|---|
| 0-20% | Very High | Low |
| 30-60% | Moderate | Steady |
| 70-100% | Low | Maximum |
This chart outlines the basic physical resistance limits at different operational angles.
Is Your Butterfly Valve Flow Curve Linear Across All Angles?
Your butterfly valve flow curve is highly non-linear at extreme low and high percentages. The output changes dramatically when the disc first cracks open and plateaus as it reaches a parallel alignment.
Why Do Extremes Behave Differently?
What’s the real story? The first few degrees of movement expose a tiny crescent-shaped gap that accelerates fluid rapidly. The final degrees of rotation barely increase the passage size. You cannot rely on a simple one-to-one ratio for automation programming.
- Initial opening causes steep velocity spikes.
- The middle zone provides predictable regulation.
- The final rotation yields negligible capacity gains.
Can You Find A Predictable Zone?
You can find a highly predictable operational range between thirty and seventy percent open. This specific middle band offers proportional regulation suitable for automated setups. Key Takeaway: Restricting your automated adjustments to the middle percentage band guarantees stable and predictable process tuning.
| Percent Open | Output Characteristics | Control Suitability |
|---|---|---|
| 0-30% | Erratic | Poor |
| 30-70% | Proportional | Excellent |
| 70-100% | Flat | Poor |
The data above highlights the specific percentage band where proportional adjustments succeed.
Why Does The Butterfly Valve Flow Curve Matter For Sizing?
Sizing relies heavily on the butterfly valve flow curve to prevent selecting hardware that is too large or too small. Oversized hardware forces the disc to operate near the closed position to maintain target rates.
What Happens With Oversized Hardware?
You might be wondering, operating a large unit at a five-percent angle creates massive velocity spikes that tear apart internal seals. Your pipes will suffer from severe vibrations and early mechanical fatigue.
- Constant low-angle operation ruins soft seals.
- High velocities strip away protective coatings.
- Vibrations loosen mechanical linkages over time.
How Do Undersized Units Fail?
An undersized unit will stay completely open and still restrict your maximum capacity requirements. You will burn out pumps trying to force enough liquid through a narrow opening. Key Takeaway: Matching the peak capacity requirement to the eighty-percent open mark gives you enough headroom for safe operation.
| Sizing Error | Operating Angle | Resulting Damage |
|---|---|---|
| Oversized | Under 20% | Seal erosion |
| Undersized | Always 100% | Pump burnout |
| Correct | 50-80% | Long lifespan |
This sizing matrix shows the operational consequences of mismatched hardware dimensions.
How Do You Predict The Exact Butterfly Valve Flow Curve?
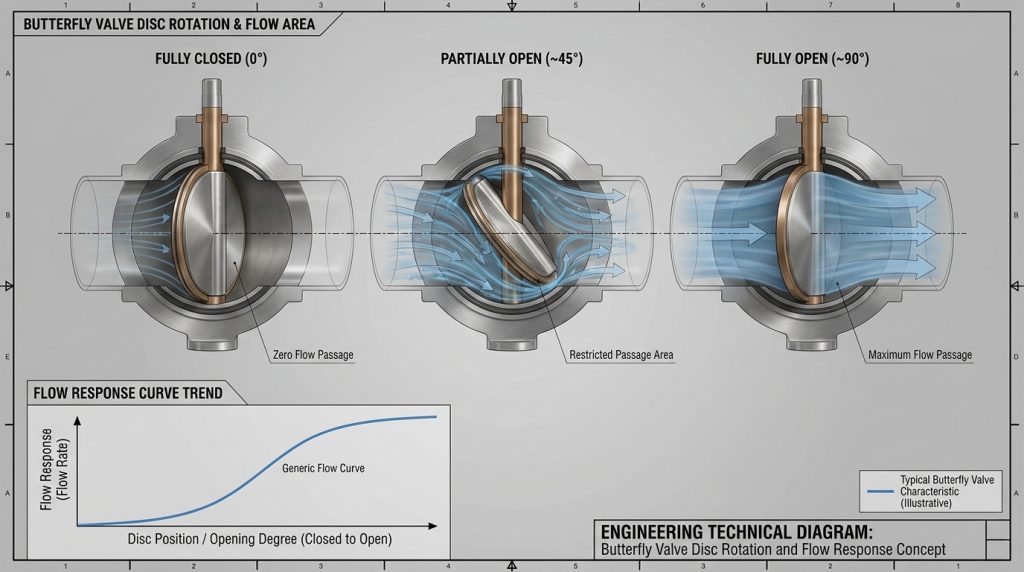
You predict the actual butterfly valve flow curve by analyzing the manufacturer coefficient charts and running fluid dynamics simulations. Software models provide a highly accurate representation of how your specific media behaves.
What Is The Flow Coefficient?
Ready for the good part? Manufacturers test their products with water to generate standard coefficient values for every angle. You can scale these baseline numbers to match your specific liquid density and pressure drops.
- Baseline tests use water at standard temperatures.
- Coefficient charts plot output against rotation angles.
- Engineers use these numbers for system software.
Why Use Digital Simulations?
Digital models factor in adjacent pipe bends and pump proximity that standard charts ignore. You can visualize the exact turbulence patterns before buying any physical hardware. Key Takeaway: Combining factory coefficient charts with digital simulation provides a completely reliable model of your future installation.
| Prediction Method | Accuracy Level | Best Use Case |
|---|---|---|
| Basic Charts | Moderate | Initial planning |
| Mathematical Scaling | High | Standard liquids |
| Digital Simulation | Maximum | Complex layouts |
These methods offer varying degrees of precision for planning your pipeline architecture.
Where Does The Butterfly Valve Flow Curve Help Applications?
HVAC and chemical processing plants rely on the butterfly valve flow curve to maintain precise temperature and mixture ratios. Industrial facilities use this data to balance huge networks of interconnected pipes without causing pressure waves.
How Do Heating Systems Benefit?
This is where it gets interesting… Climate control grids adjust chilled water streams constantly based on building temperatures. Accurate curve mapping prevents sudden temperature swings that frustrate building occupants.
- Chilled water loops require smooth transitions.
- Heating grids demand stable pressure heads.
- Boiler feeds need precise volume regulation.
Why Do Chemical Plants Need This?
Mixing hazardous chemicals requires exact ratios to prevent ruined batches or dangerous reactions. Operating within the predictable middle band gives operators complete command over the mixing process. Key Takeaway: Mapping the behavioral curve allows heavy industries to automate complex fluid transfers safely and predictably.
| Industry | Primary Fluid | Curve Dependency |
|---|---|---|
| HVAC | Chilled Water | Temperature stability |
| Chemical | Acids/Bases | Exact mixture ratios |
| Food Prep | Syrups | Consistent output |
This table demonstrates how different sectors rely on precise operational mapping.
How Can The Butterfly Valve Flow Curve Optimize Efficiency?
Analyzing your butterfly valve flow curve helps you program automated actuators to minimize energy waste during adjustments. You stop forcing pumps to work against severely restricted pathways by keeping the disc at better angles.
Can You Reduce Power Consumption?
Consider this, every sudden restriction in the pipeline makes your main pump draw more electricity. Tuning the actuator to move smoothly along the proportional band reduces the electrical load on your facility.
- Smooth movements prevent pump strain.
- Correct angles reduce electrical draw.
- Proper tuning lowers utility bills.
How Does Wear And Tear Decrease?
Running equipment in the most stable zone reduces the physical stress on metal shafts and gearboxes. You save significant money on replacement parts and labor over the lifespan of the plant. Key Takeaway: Aligning your operational habits with the physical data reduces both your monthly power bill and your yearly maintenance budget.
| Operation Zone | Pump Strain | Energy Cost |
|---|---|---|
| <20% Open | High | Expensive |
| 40-70% Open | Minimal | Cheap |
| >90% Open | Low | Moderate |
These figures illustrate the direct financial impact of operating at different rotational angles.
What Factors Distort The Typical Butterfly Valve Flow Curve?
Nearby elbows, varying fluid viscosities, and extreme temperature changes will distort the baseline butterfly valve flow curve you see on paper. These external variables change how the liquid approaches the disc mechanism.
How Does Piping Geometry Interfere?
Let me explain, placing an elbow joint too close to the mechanism creates a lopsided velocity profile. The liquid hits one side of the disc much harder than the other side. You must leave straight pipe sections before and after the installation.
- Elbows create uneven fluid velocities.
- Reducers compress the stream unnaturally.
- T-junctions cause unpredictable turbulence.
Do Thick Fluids Act Differently?
Heavy syrups or sludges do not accelerate as quickly as water when the gap widens. You have to apply specialized correction factors to the baseline charts when handling dense materials. Key Takeaway: You must evaluate the physical surroundings and the specific liquid properties rather than trusting the laboratory charts blindly.
| Factor | Distortion Effect | Solution |
|---|---|---|
| Pipe Elbows | Uneven velocity | Add straight pipes |
| Thick Sludge | Sluggish response | Use correction math |
| Extreme Heat | Hardware expansion | Allow tolerances |
This breakdown highlights the external factors that ruin standard laboratory predictions.
Does Valve Seat Style Change The Butterfly Valve Flow Curve?
The profile of the internal seat liner definitely shifts the butterfly valve flow curve during the initial degrees of movement. Thick rubber liners create more friction than thin metal rings as the disc breaks away from the closed position.
How Do Soft Liners Perform?
Think about it, rubber components bulge slightly under heavy pressure. This compression changes the exact moment the liquid actually starts moving past the metal disc edge.
- Rubber seats delay the initial fluid surge.
- Teflon liners provide a slicker breakaway.
- Elastomer materials bulge under high pressure.
What About Metal Seating?
Metal rings do not compress, meaning the gap opens exactly when the shaft turns. You get a much sharper and immediate response when dealing with high-temperature metal configurations. Key Takeaway: Factoring in the liner material gives you a more realistic timeline of when the fluid actually breaches the barrier.
| Seat Material | Breakaway Friction | Initial Response |
|---|---|---|
| Rubber | High | Delayed |
| Teflon | Moderate | Smooth |
| Solid Metal | Low | Immediate |
This comparison shows how the internal lining alters the very first moments of rotation.
When Does Cavitation Alter The Butterfly Valve Flow Curve?
Cavitation completely wrecks the predicted butterfly valve flow curve by introducing vapor bubbles that block liquid passage. These bubbles form when the internal pressure drops too fast across a narrow opening.
How Do Vapor Bubbles Choke The System?
Want to know a secret? Once the fluid turns into vapor, the volume expands massively and clogs the physical space. Turning the shaft further open will not increase your output because the gas acts like a solid plug.
- Rapid pressure drops boil the liquid.
- Vapor bubbles consume the available space.
- Output flatlines despite further rotation.
Can You Prevent This Phenomenon?
You keep the pressure drop within safe limits by keeping the disc in a wider stance. Installing multiple units in a series spreads the pressure drop safely across several stages. Key Takeaway: Preventing vapor formation keeps the fluid acting like a liquid, which preserves your mathematical predictions.
| Condition | Fluid State | Output Behavior |
|---|---|---|
| Normal Drop | Liquid | Predictable |
| Sharp Drop | Boiling Vapor | Choked flatline |
| Multi-stage | Liquid | Stable |
This chart explains how severe pressure drops fundamentally change the nature of the fluid.
How Do You Monitor The Butterfly Valve Flow Curve On Site?
You track the butterfly valve flow curve during active operations by linking smart positioners to downstream flow meters. This hardware combination feeds real-time data back to your central control dashboard.
What Do Smart Positioners Do?
The truth is, a digital positioner constantly reads the exact angle of the shaft. It compares this physical angle against the target value from the main computer to make micro-adjustments instantly.
- Sensors read the physical shaft angle.
- Microprocessors calculate necessary corrections.
- Digital signals alert the main dashboard.
How Do Flow Meters Complete The Loop?
The meter measures the actual gallons per minute passing through the pipeline. The software compares the physical angle to the actual gallons to plot your real-time performance graph. Key Takeaway: Installing active digital sensors turns theoretical factory charts into actionable, real-time intelligence for your operators.
| Sensor Type | Measurement Target | Feedback Value |
|---|---|---|
| Positioner | Shaft Rotation | Exact Angle |
| Flow Meter | Liquid Volume | Gallons per Minute |
| Main Dashboard | Combined Data | Real-time Graph |
This equipment list details the components required to build a live performance tracking system.
Mastering the mechanics behind fluid regulation protects your infrastructure from unexpected pressure spikes and premature mechanical wear. We provide precise sizing strategies and operational mapping that eliminate guesswork from your pipeline management. Proper tuning gives you total command over your process loops and slashes unnecessary power consumption. If you need help stabilizing your fluid network, contact us today for customized engineering support. We build reliable control technology that keeps global industries operating safely and efficiently.
FAQ
Q1: Can I use a single flow chart for all my valves?
No, you cannot. Different disc designs, seat materials, and pipe diameters change the operational resistance, meaning each specific model requires its own dedicated data chart.
Q2: What’s the best percentage angle for stable regulation?
The middle band between thirty and seventy percent is the best range. This zone provides proportional responses without causing extreme velocity spikes or severe cavitation issues.
Q3: How do I know if my hardware is oversized?
You will notice the actuator constantly hovering below twenty percent open. The system will struggle with erratic pressure swings because the large gap accelerates fluid too quickly at low angles.
Q4: Can I run my pipeline safely at maximum capacity?
Yes, but you lose your ability to handle sudden volume surges. Leaving your hardware fully open removes any extra headroom needed to adjust for unexpected upstream pressure drops.
Q5: What’s the best way to stop vapor bubbles from forming?
Keeping the pressure differential across the mechanism as small as possible is the best method. Widening the disc angle or adding multiple stages prevents the sharp drops that boil the liquid.